Data Engineering
This page compares the Connected AI platform-enabled options for big data processing: AWS Glue and AWS Elastic Map Reduce (EMR).
This section assumes you are comfortable with Spark processing using Python or Scala. This page does not provide wider suggestions regarding big data processing.
Table of Contents
- Glue vs EMR
- Comparison Overview
- Detailed Comparison & Usage
- EMR Observability and Monitoring
- Best Practices
- Troubleshooting
Glue vs EMR
Glue and EMR are managed services to run Spark applications: you should not need to setup the underlying infrastructure (e.g., IAM roles or S3 permissions) as the Connected AI platform and AWS will do this under the hood.
Both have limitations both from AWS and Connected AI platform implementation of these options.
- While Glue is fully managed, it has a higher bill rate and is less customizable.
- On the other hand, Connected AI EMR is sensitive to the raw data location and Spark code experience.
Comparison Overview
When choosing either of the options, you should consider the limitations of how the Connected AI platform enables them. The table below summarizes the comparison of the two options. Further down below, we clarify these comparison points and detail the usage of each option under these points.
| Feature | AWS Glue | EMR on Connected AI |
|---|---|---|
| Kubeflow Pipelines Integration | ✅ See Glue Example | ✅ See EMR Example |
| Bill Rate | ❌ $0.46 per DPU-hour | ✅ ~$0.23 per DPU-hour* |
| Integration with Glue Data Catalog | ✅ Out of the box | ✅ In principle, out of the box |
| Cross-region Compatibility | ✅ Raw data can be processed in all CDH regions directly | ❌ Can only be executed in CAIP regions |
| Spark Environment Configuration | ⚠️ May be limited for highly specific scenarios | ✅ Full configuration power |
| Dependency Management | ✅ Enlist dependencies at job run time | ❌ Requires building base Docker image |
| Scalability | ✅ Within AWS service limits (quotas) | ✅ Up to 144 EC2 instances of configurable size |
| Developer Notebook Experience | ✅ Interactive Glue Session | ❌ Not yet available on Connected AI Platform |
*Exact costs depend on the scaling of the underlying K8s cluster
Note on Cross-region Compatibility: In EMEA, raw data has to be transferred from a CDH region (Ireland) to a CAIP region (Frankfurt). Cross-region transfer costs need to be considered.
Detailed Comparison & Usage
Kubeflow Pipelines Integration
AWS Glue
This example pipeline uses a Kubeflow Pipelines component which under the hood creates the required job-specific infrastructure. All you have to do is to provide job arguments and configuration parameters for Glue jobs, similar to creating them via the Glue console.
The value of a Kubeflow pipeline run in this regard is that it:
- Awaits the Glue job execution
- Can pass the result on to subsequent pipeline steps
- Keeps your job definitions tracked in version control on GitHub
The component that the pipeline uses is aligned with our IAM: CDH data access and access for your S3 data. You may observe the job runs from the Management Console as well as access the input and output data and control data access end-to-end.
EMR
Our EMR implementation is very similar to that of Glue. This example pipeline also uses a Kubeflow Pipelines component. All you have to do is to provide job arguments and configuration parameters for EMR jobs, e.g., Spark worker count and size.
It also has the CDH data access and access for your S3 data. You may observe the job runs from the Management Console and access the Spark UI.
Bill Rate
Bill Rate vs. Cost: The bill rate isn't a reliable approximation of cost, also for comparing the two options.
AWS Glue
Estimated Costs presents a detailed comparison of pure Python jobs on Kubernetes with running the same logic in Glue. In a nutshell, the Glue bill rate is $0.46 per DPU-hour (eu-west-1 AWS region), where DPU is a Glue data-processing unit, roughly equivalent to 8 CPUs and 32 GBs of RAM.
In other words, the bill rate is how much you pay per DPU running for an hour for your job.
EMR
EMR scripts that you execute from Kubeflow Pipelines get scheduled on AWS EC2 instances as configured in your product.yaml on Orbit's side. By default, these instances are m5*.2x.large, of 16 CPUs and 32 GBs of RAM, with the bill rate of $0.23 (eu-central-1 AWS region).
Integration with Glue Data Catalog
Roughly, Glue catalog allows accessing S3 data as if it were a SQL database.
AWS Glue
You may crawl your S3 data via a Kubeflow Pipeline or access the CDH databases and tables via the Glue Data Catalog. All you have to do is to enable its usage as metadata store in your Glue job via the appropriate flag.
EMR
EMR, in principle, has the same seamless Glue Data Catalog integration. However, if you get into access exceptions, refer to AWS documentation for using the AWS Glue Data Catalog as the metastore for Spark SQL and extend your roles following the pull-request based self-service process.
Cross-region Compatibility
AWS Glue lets you process your raw data directly in a CDH region (e.g., eu-west-1).
With EMR, on the other hand, the data needs to be processed in the same region as the Connected AI platform (e.g., eu-central-1).
Cross-region Transfer Cost
This aspect may therefore require you to introduce cost-increasing data transfer steps. For example:
- Processing 100 GB of raw CDH data in eu-west-1 with the output of 10 GB would incur the data transfer cost of
10 * $0.02 = $0.2to your Connected AI eu-central-1 AWS region (per S3 Pricing) - Data transfer in the EMR case between these AWS regions would cost $2
This aspect should be considered when choosing between AWS Glue and EMR on the cost basis.
Spark Environment Configuration
AWS Glue
Glue exposes configurable Spark environment parameters, e.g., data shuffling, via job argument flags. Some parameters are passed to Glue directly, e.g., number of workers at the component (pipeline step) level.
EMR
Our EMR abstraction allows passing extra Spark configuration at the component (pipeline step) level. The common parameters, e.g., number of drivers and executors, are to be passed to EMR in the same way but via dedicated input arguments to the emr_op component.
Dependency Management
AWS Glue
Glue allows specifying pip and Maven dependencies at job runtime, via a dedicated job argument flag.
EMR
Our EMR abstraction requires building a custom Docker image with Python or Scala dependencies to be used throughout your Spark application. Maven or S3-hosted dependencies for Java can be specified in part of your extra Spark configuration.
Scalability
AWS Glue
Glue jobs are limited to quotas for your AWS account in each AWS region.
EMR
EMR workloads run on your Kubernetes cluster (i.e., Orbit platform) EC2 instances. These clusters support auto-scaling with up to 144 instances. You may configure instance size in your product.yaml as defined in the instance mapping.
Kubeflow Pipeline Steps, Spark Executors, & EC2 Instances: Steps of your Kubeflow pipeline, e.g., for spinning EMR or Glue jobs are only responsible for seeing the job through. The job itself runs on Spark drivers and executors as you configure them.
Both the pipeline steps and Spark tasks get distributed across EC2 instances, meaning that if your Spark executor size or Kubeflow pipeline step size are lower than the configured EC2 instance size, one instance accommodates multiple workers.
Developer Notebook Experience
AWS Glue
If you like to conduct data analysis in a notebook environment, you can do this directly from the Kubeflow UI using a Glue-based PySpark kernel. This may well allow Data Science teams to rapidly conduct data analysis and data experiments with minimal setup time or effort.
EMR
On the other hand, the Connected AI platform does not provide a Notebook environment for EMR out of the box.
No-code ETL Jobs
Note: We don't consider this point to be decisive.
AWS Glue
Glue provides a very wide range of commonly used ETL processes out-of-the-box (Visual ETL with AWS Glue Studio). You are able to use these to create an ETL pipeline using a visual interface, and therefore may be able to construct a pipeline without any coding required.
EMR
EMR, on the other hand, has no such tooling readily available. Note that this does not mean that developing ETL pipelines on EMR is particularly complex, but you will need to be able to code processing steps yourself.
EMR Observability and Monitoring
This guide shows how to improve observability on the Spark (EMR on EKS) jobs with Prometheus and Grafana.
Overview
The Kubeflow component for running Spark jobs in your Connected AI cluster(s) from version 1.6.0 exposes Prometheus-formatted metrics by default. These metrics can be displayed in Grafana for comprehensive monitoring and visualization of your EMR workloads.
Suggested Dashboard
We recommend using the AWS Labs dashboard for Spark (EMR on EKS) which provides comprehensive monitoring capabilities for your Spark jobs.
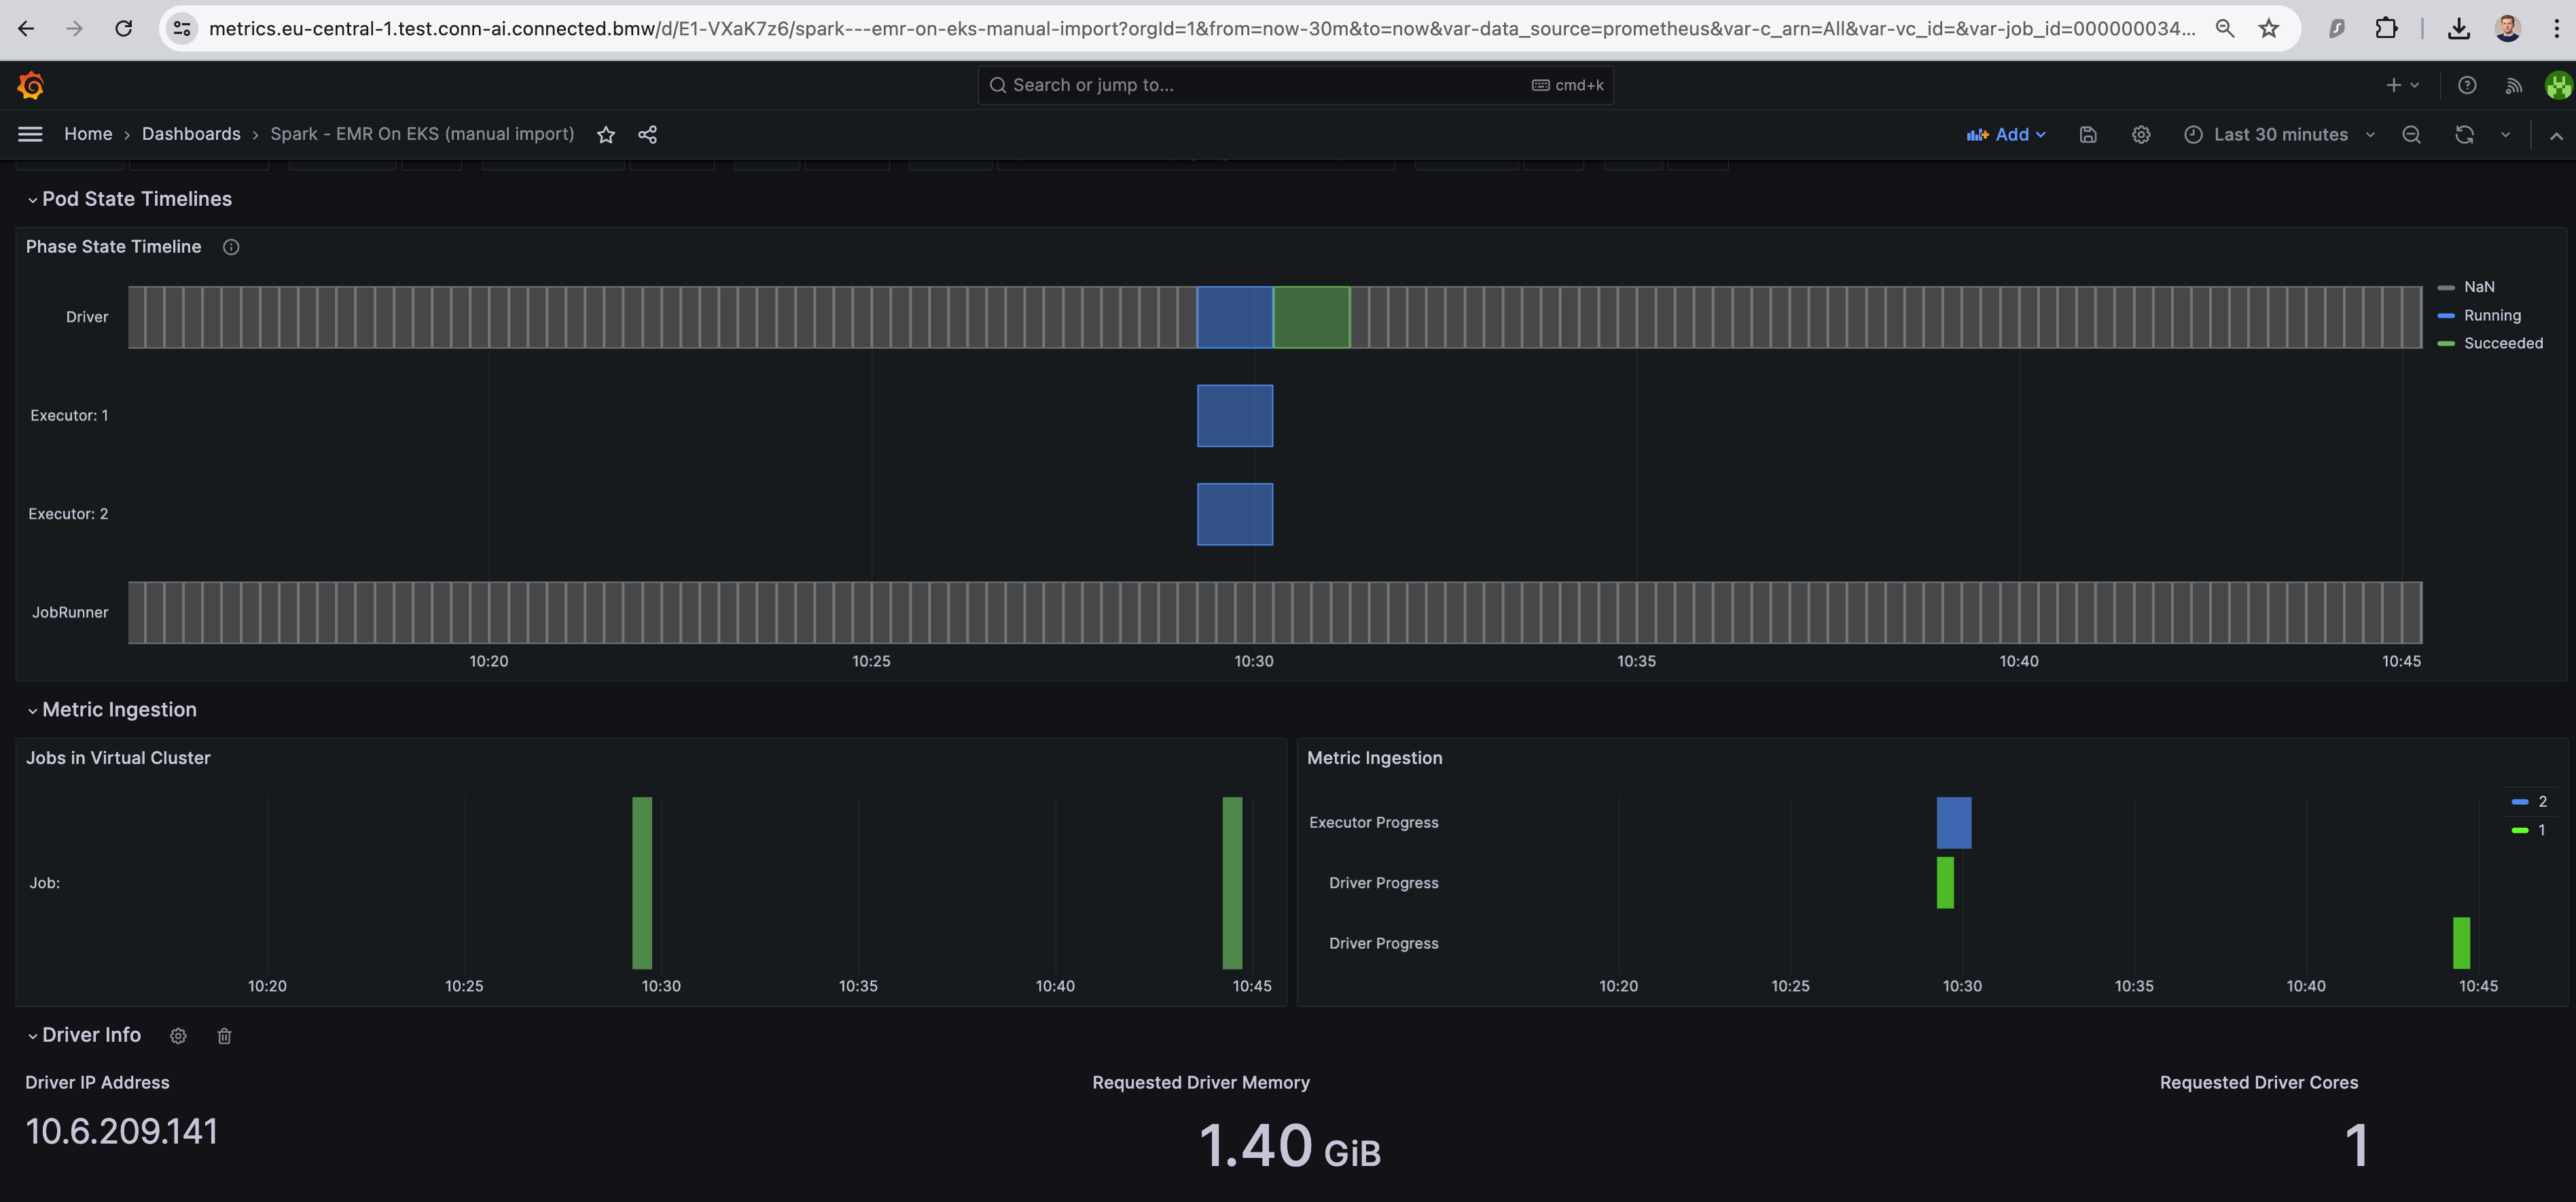
Dashboard Features
The dashboard allows filtering by:
- Driver ID: Monitor specific driver instances
- Executor ID: Track individual executor performance
- Node: View metrics per Kubernetes node
- Virtual Cluster ID: Organize by cluster identification
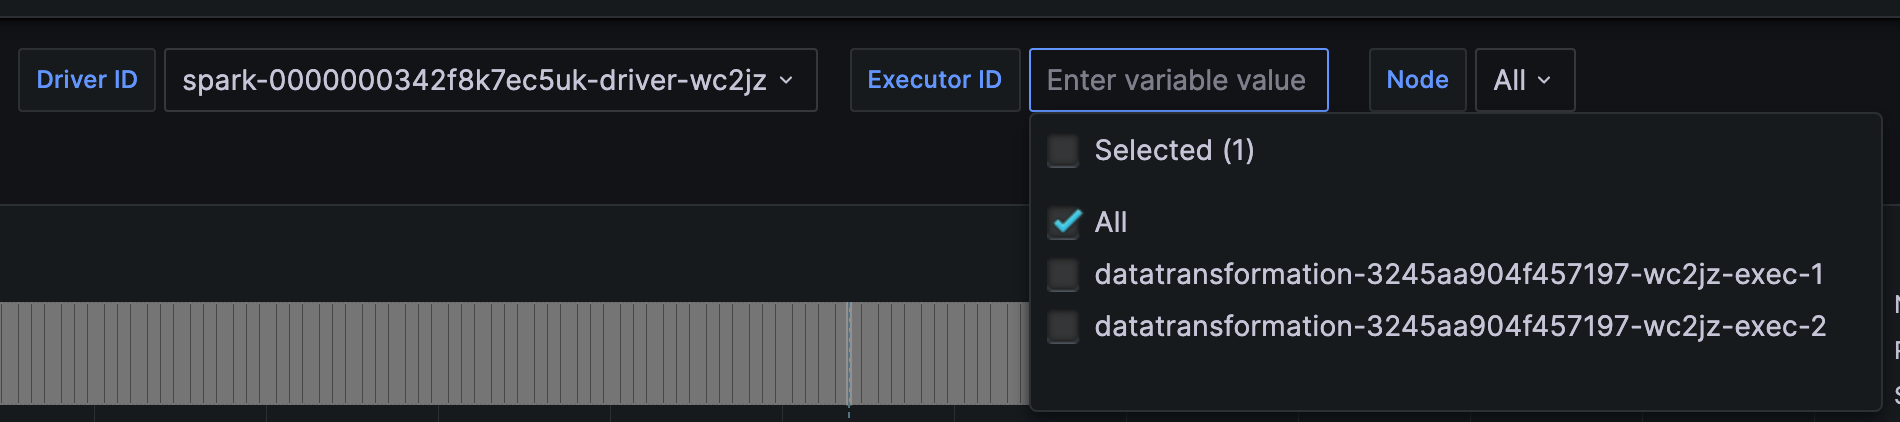
Having selected the job ID, you can see the mapped driver and executors in the drop-down menus for detailed analysis.
Available Visualizations
Spark Application Level:
- Spark application timeline
- Job execution progress and status
Driver and Executor Level:
- Memory & CPU usage through time
- Data shuffling metrics through time
- Heap vs. Off-Heap memory utilization through time
- Garbage collection performance metrics
These visualizations essentially provide the same details you would see in the Spark UI, but with the added benefit of historical data retention and alerting capabilities.
How to Provision the Dashboard
Check for Existing Dashboard
Before proceeding, ensure that you don't already have the "Spark - EMR On EKS" dashboard by searching in the Grafana System Metrics UI:
Note: The approach outlined below ensures the persistence of your Grafana dashboard(s) across cluster updates.
Step 1: Prepare Dashboard Configuration
Having authenticated in your Connected AI cluster(s), save this dashboard YAML to your local environment or using VS Code in Kubeflow environment:
dashboard.yaml
apiVersion: v1
kind: ConfigMap
metadata:
  name: spark-emr-dashboard
  namespace: <YOUR-NAMESPACE>
  labels:
    grafana_dashboard: "1"
data:
  spark-emr-dashboard.json: |
    {
      "dashboard": {
        "id": null,
        "title": "Spark - EMR On EKS",
        "tags": ["spark", "emr", "eks"],
        "timezone": "browser",
        "panels": [
          // Dashboard configuration details
        ],
        "time": {
          "from": "now-1h",
          "to": "now"
        },
        "timepicker": {},
        "templating": {
          "list": []
        },
        "annotations": {
          "list": []
        },
        "refresh": "30s",
        "schemaVersion": 27,
        "version": 1,
        "links": []
      }
    }
Step 2: Apply Dashboard to Cluster
Apply the dashboard YAML to your Connected AI profile namespace:
kubectl apply -f dashboard.yaml -n <YOUR-NAMESPACE>
Step 3: Verify Dashboard Installation
After applying the configuration, you will find the "Spark - EMR On EKS" dashboard when searching in the Grafana System Metrics UI:
Important Considerations
- Unique Naming: Ensure that the dashboard name and ID are unique within your Connected AI cluster
- Namespace Isolation: Each namespace can have its own dashboard configuration
- Metrics Retention: Historical metrics are retained according to your cluster's Prometheus configuration
- Resource Impact: Monitor the impact of metrics collection on job performance
Troubleshooting
Common Issues
-
Dashboard Not Appearing
- Verify the ConfigMap was applied to the correct namespace
- Check Grafana dashboard auto-discovery configuration
- Ensure proper labeling (
grafana_dashboard: "1")
-
Missing Metrics
- Confirm EMR component version is 1.6.0 or later
- Verify Prometheus is scraping the correct endpoints
- Check Spark job configuration for metrics enablement
-
Performance Impact
- Monitor the overhead of metrics collection
- Adjust metrics collection frequency if needed
- Consider sampling for high-volume jobs
References
- Technical Documentation: EMR on EKS - System Metrics
- AWS Labs Dashboard: Official Spark EMR Dashboard
- Prometheus Configuration: Spark Metrics Configuration
Best Practices
Choosing Between Glue and EMR
Choose AWS Glue when:
- You need cross-region data processing
- You prefer fully managed services
- You want to use interactive notebooks for development
- Your team has limited Spark configuration experience
- You need no-code ETL capabilities
Choose EMR when:
- Cost optimization is a priority
- You need full Spark configuration control
- Your data is already in the same region as Connected AI Platform
- You have expertise in containerized environments
- You require custom dependency management
Cost Optimization Tips
-
For Glue:
- Monitor DPU usage and optimize job parameters
- Use appropriate worker types for your workload
- Consider data partitioning to reduce processing time
-
For EMR:
- Configure appropriate instance sizes in
product.yaml - Optimize Spark executor and driver configurations
- Consider data locality to minimize cross-region transfers
- Configure appropriate instance sizes in
Development Workflow
- Start with prototyping using Glue interactive sessions for rapid development
- Profile your workload to understand resource requirements
- Choose the appropriate service based on your specific requirements
- Implement in Kubeflow Pipelines for production workflows
- Monitor and optimize based on actual usage patterns
Efficient PySpark Code
To get started with Spark in Kubeflow Pipelines, refer to the pipeline examples in the Kubeflow Pipelines Integration section.
This section highlights high-value, quick-win best practices for (Py)Spark development gathered from Connected AI use cases. These suggestions help speed up your Spark data transformations and reduce costs.
DataFrame Types Overview
Throughout this section:
dfdenotes Pandas DataFramesdfdenotes Spark DataFramepsdfdenotes Pandas on Spark DataFrame
DataFrame: Spark vs. Pandas
Transformations on Pandas DataFrames don't get parallelized out of the box. To make use of Spark parallelization, the easiest way is to convert to a Pandas on Spark DataFrame:
From Pandas to Pandas on Spark:
import pyspark.pandas as ps

psdf = ps.from_pandas(df)
You can then run most Pandas DataFrame methods in parallel. However, some methods have reduced functionality (e.g., for row-wise operations) - refer to the PySpark Pandas API user guide.
From Pandas to Spark:
from pyspark.sql import SparkSession

spark = SparkSession.builder.appName("DataTransformation").getOrCreate()
sdf = spark.createDataFrame(df)
From Spark to Pandas on Spark:
psdf = sdf.pandas_api()
⚠️ Warning: The following method removes parallelization as your Spark DataFrame gets converted to a Pandas DataFrame:
Reduced Serialization in UDFs
Spark User Defined Functions (UDFs) allow parallelizing custom logic over Spark executors. To achieve parallelization, they have restrictions on input and output data types, requiring serializable inputs.
Consider an example of inference for big data with one million rows:
UDF as Usual (Inefficient): An immediate approach might load the model (e.g., stored in S3) once and pass it to the serving UDF to avoid loading the model one million times. However, the model will still get deserialized on every prediction, resulting in significant execution time.
UDF with Reduced Serialization (Efficient): Instead of row-wise complex input loading, load such inputs per executor:
from pickle import loads
import pyspark.sql.functions as f
import pyspark.sql.types as t
from boto3 import resource
from numpy import ndarray
from pyspark.ml.functions import predict_batch_udf

def serve():
    s3 = resource("s3")
    model_file = (
        s3.Bucket(model_bucket)
        .Object(model_key)
        .get()["Body"]
        .read()
    )
    model = loads(model_file)

    def get_predictions(x: ndarray):
        return model.predict(x)

    return get_predictions

serve_udf = predict_batch_udf(
    serve,
    return_type=t.FloatType(),
    input_tensor_shapes=[[len(features.columns)]],
    batch_size=10000
)
sdf = sdf.withColumn("predictions", serve_udf(f.array(features)))
In this approach:
- The
servefunction gets serialized instead of the model object - It's a smaller object compared to the model
- Gets serialized per executor (not per row)
- The function is called 100 times (one million ÷ 10K batch size)
This significantly reduces execution time from hours to minutes on the same executor configuration.
💡 Spark Native Functions: As Spark evolves, common parallelization needs are implemented natively. The
predict_batch_udfML function used above was introduced in Spark 3.4 (June 2023).
Caching
Data in Spark only gets materialized on commands that need the data itself (e.g., write, collect, or count). Repeating such operations on comparable DataFrames can induce unnecessary overhead.
Example: Repeated Count (Inefficient):
import pyspark.sql.functions as f

max_nan_count = sdf.count() * 0.9
nan_row_count = sdf.filter(
    f.greatest(*[f.col(c).isNull() for c in sdf.columns])
).count()
Without caching, since data hasn't been materialized, this code tells Spark to plan loading sdf twice.
With Spark Cache (Efficient):
sdf.cache()

max_nan_count = sdf.count() * 0.9
nan_row_count = sdf.filter(
    f.greatest(*[f.col(c).isNull() for c in sdf.columns])
).count()
Invoking cache() before executing operations tells Spark to use the cached sdf throughout, eliminating redundant data loading.
Additional Performance Tips
- Use Column Operations: Prefer Spark SQL functions over UDFs when possible
- Partitioning: Ensure proper data partitioning for optimal parallelization
- Broadcast Variables: Use broadcast variables for small lookup tables
- Avoid Collect: Minimize use of
.collect()and.toPandas()operations - Resource Configuration: Tune executor memory and cores based on your workload
Performance Monitoring
Monitor your Spark jobs using the EMR Observability tools to identify bottlenecks and optimization opportunities.
For further tuning your Spark logic performance, refer to the official Spark Performance Tuning guide.
Troubleshooting
Common Issues
AWS Glue
- Permission errors: Verify IAM roles and S3 bucket policies
- Performance issues: Check DPU allocation and data partitioning
- Dependency conflicts: Ensure compatible library versions
EMR
- Cross-region access: Verify data is in the correct region
- Resource allocation: Check Kubernetes cluster capacity
- Custom images: Ensure Docker images are properly built and accessible
Support
For technical support with data engineering workflows, contact the Connected AI Platform team.