Data Visualization
Streamlit
Streamlit is a powerful Python library designed for building interactive and customizable web applications for data science and machine learning projects. Streamlit allows users to effortlessly create and share data-driven applications by writing simple Python scripts. Streamlit takes care of the frontend rendering, making it easy to focus on the core functionality and visualizations of your application. Streamlit's key features include rapid prototyping, automatic UI updates, and easy integration with popular data science libraries. See the official Streamlit docs for more information.
This section details the usage of Streamlit on the Connected AI platform in these guides:
Table of Contents
- ECR Repository
- Simple Example
- Access Streamlit App UI
- Advanced Examples - Model Monitoring
- Query Glue Tables & Parquet Files - Advanced Example
- S3/Parquet - Reports on Parquet Files
- Expose Streamlit to Product Non-Developers
ECR Repository
Before starting a Streamlit application, you need to request an Amazon Elastic Container Registry (ECR) repository. You may do so via Orbit's self-service portal. Please select your desired namespace. The resulting ECR repository would, for example, be:
TARGET_ECR: "493239015811.dkr.ecr.eu-central-1.amazonaws.com"
ECR_REPOSITORY: "conn-ai/ai-hworld/streamlit-demo"
Team Space Owner
If you do not see the "add new ECR" button (on the bottom left corner) you can ask the respective Team Space owner(s) to do this. One can see the members roles in the TEAM tab inside the respective Team Space.
This repository will host versions of your Streamlit application. Proceed to the next pages in this section to get started with your first application.
Simple Example
We provide an example repository (conn-ai-demo / streamlit-demo) that gives you the basic guideline on how to build a simple Streamlit visualization on your datasets in Python. In addition, it demonstrates the way to run the app inside VS Code server provided by the Connected AI platform. Furthermore, if you would like to host the app on CAIP, CAIP team also provide an easy CI/CD workflow to host it.
Developing Streamlit App in VS Code in Kubeflow
Developing a Streamlit dashboard is straightforward. To do so, you may use any integrated development environment (IDE) tool, e.g., Connected AI VS Code Server Notebooks. The latter provide AWS permissions, such as for S3 data.
From IDE, you need to follow the steps below.
1. Install Streamlit
Streamlit is a Python library. To install it, for example, run:
pip install streamlit
2. Code App
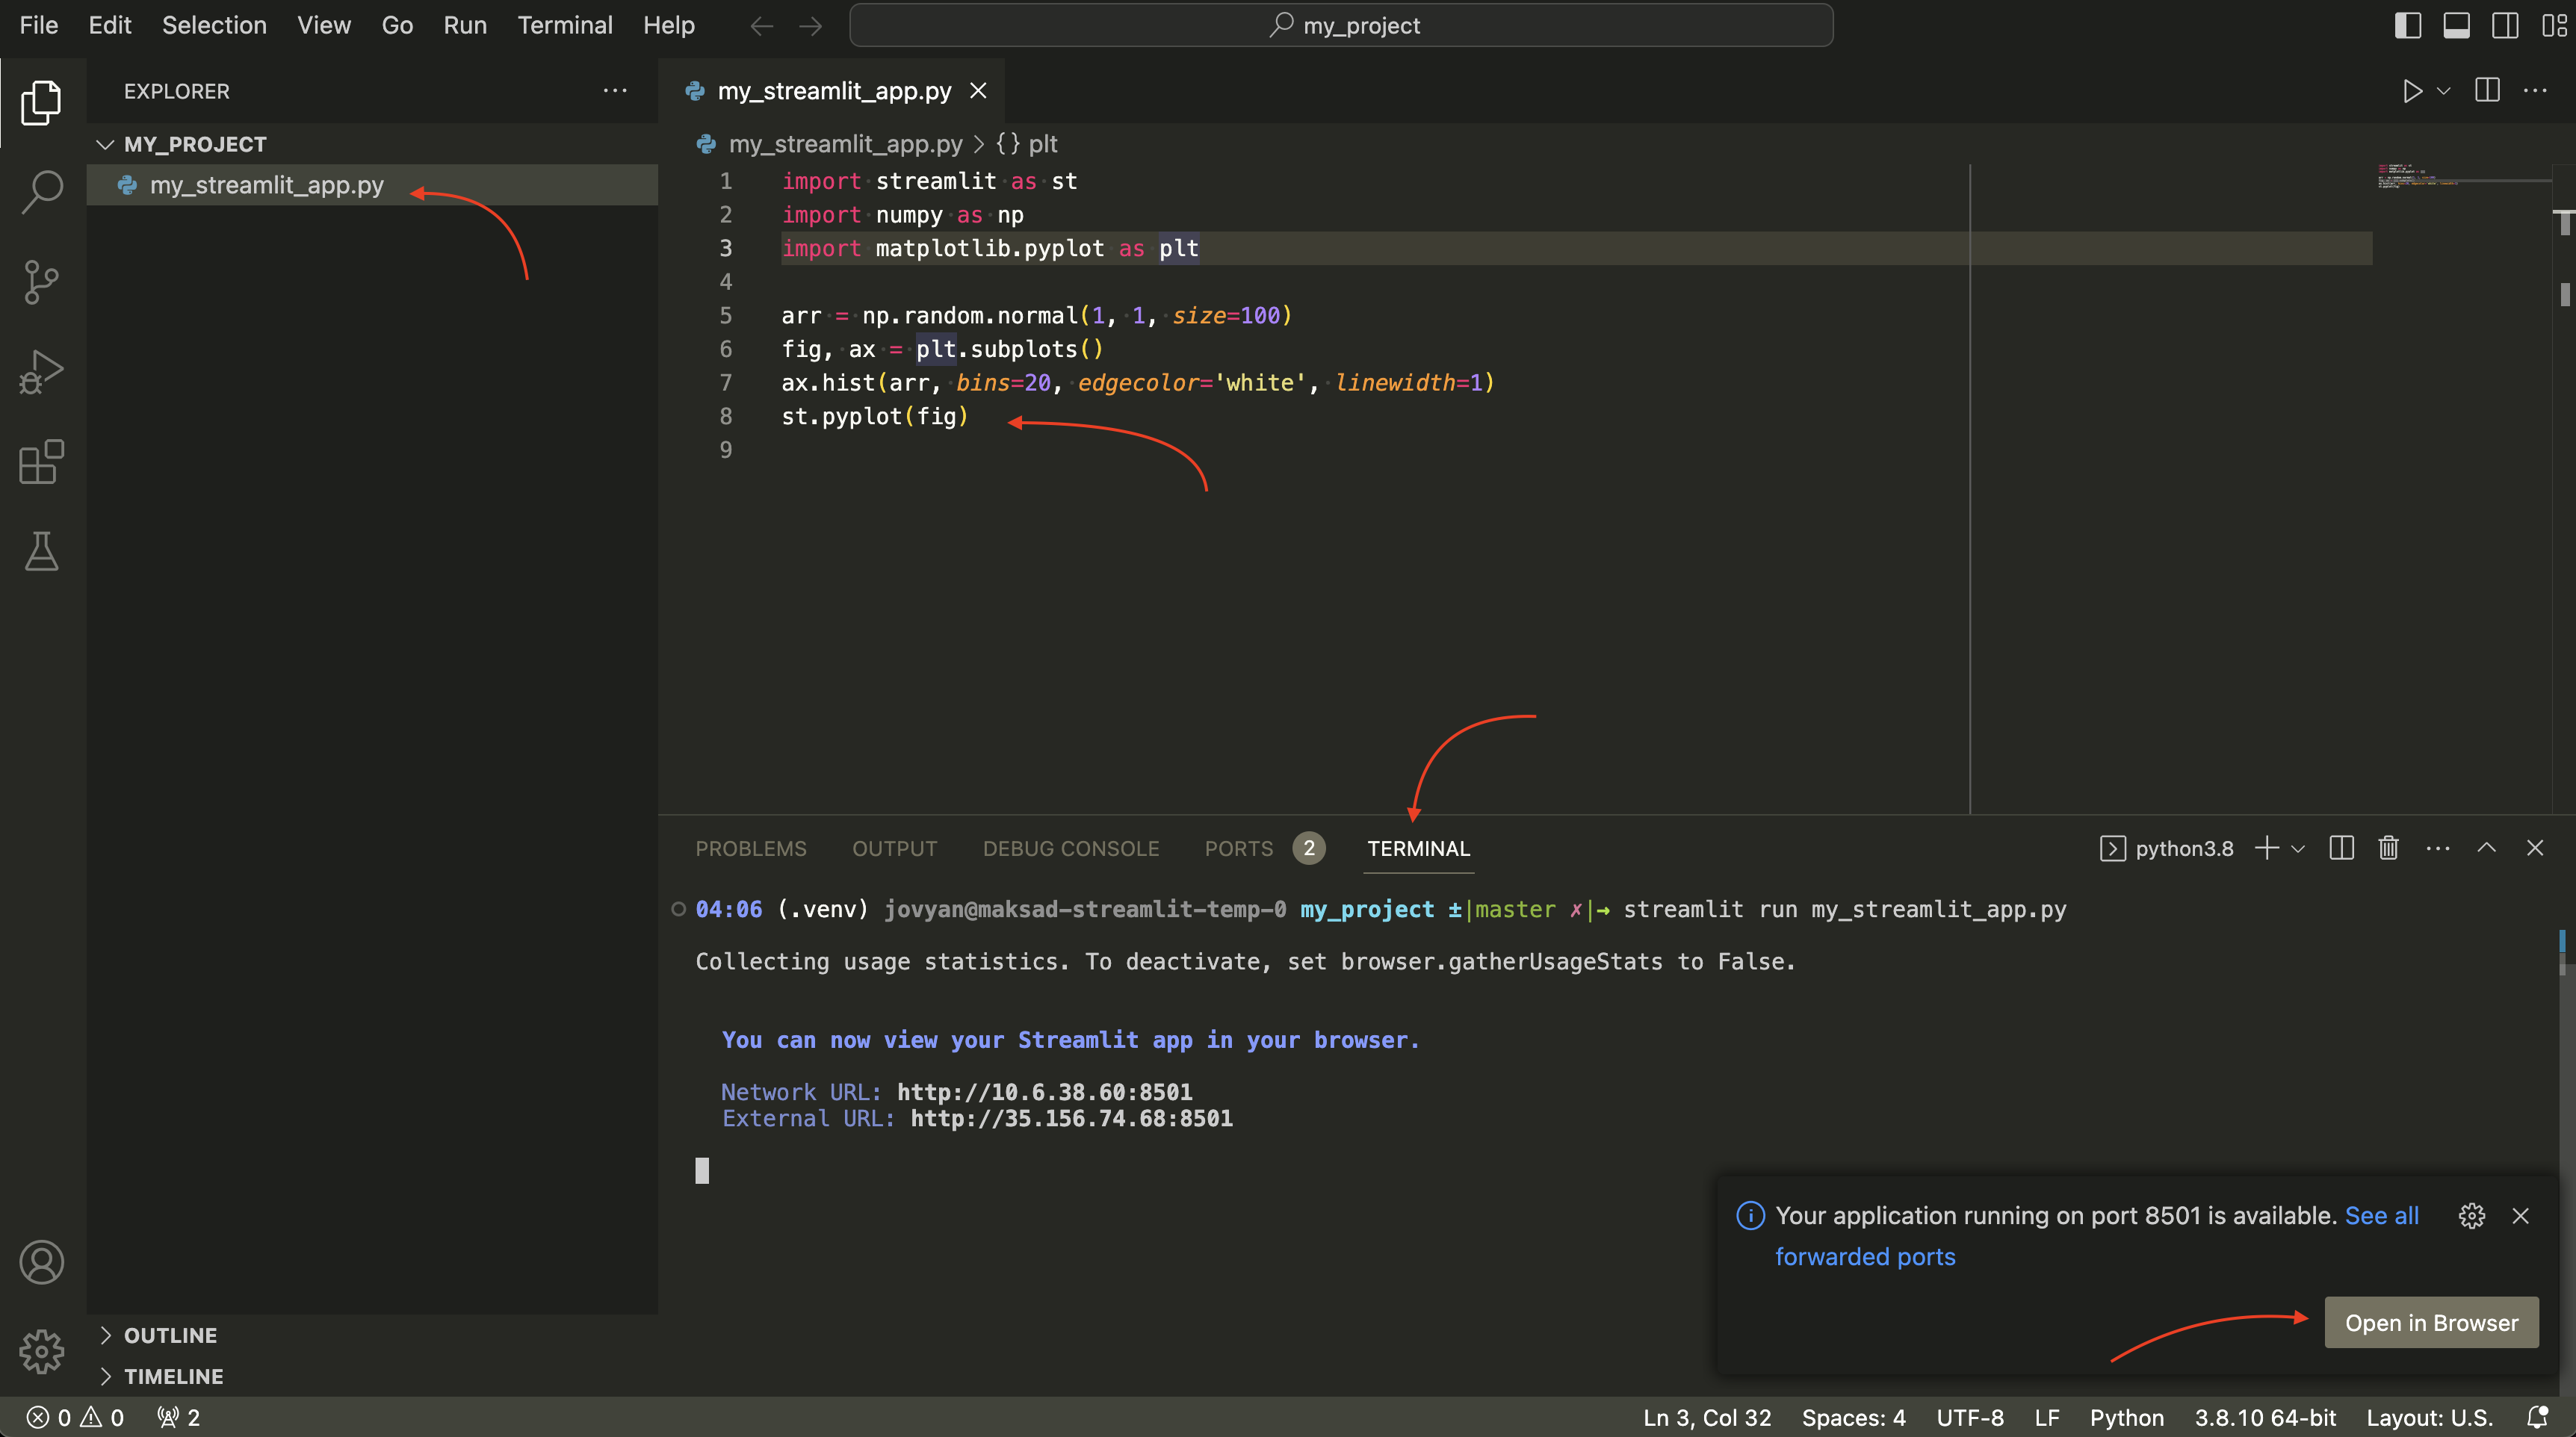
The most basic app you need to code is as follows:
import streamlit as st
import numpy as np
import matplotlib.pyplot as plt

arr = np.random.normal(1, 1, size=100)
fig, ax = plt.subplots()
ax.hist(arr, bins=20, edgecolor='white', linewidth=1)
st.pyplot(fig)
You may use our get started example–you need to clone the repository to your VS Code notebook:
git clone https://bmw.ghe.com/conn-ai-demo/streamlit-demo.git
cd streamlit-demo/app
pip install -r requirements.txt
To extend the above code snippets, refer to Streamlit's Get Started to find the functions and methods that correspond to your needs.
3. Run the App
Run your Streamlit application by executing the following command:
streamlit run <app/app.py>
Replace <app/app.py> with the appropriate path you have in your setup.
4. Display the App
Having run the app, the VS Code IDE automatically starts port-forwarding. By clicking "Open in Browser", you may preview your app:
You may also navigate to the "Port" tab's "Preview" button. It will display the app directly in VS Code. Streamlit detects any code changes and asks you to re-start the app. You can choose to "Always rerun":
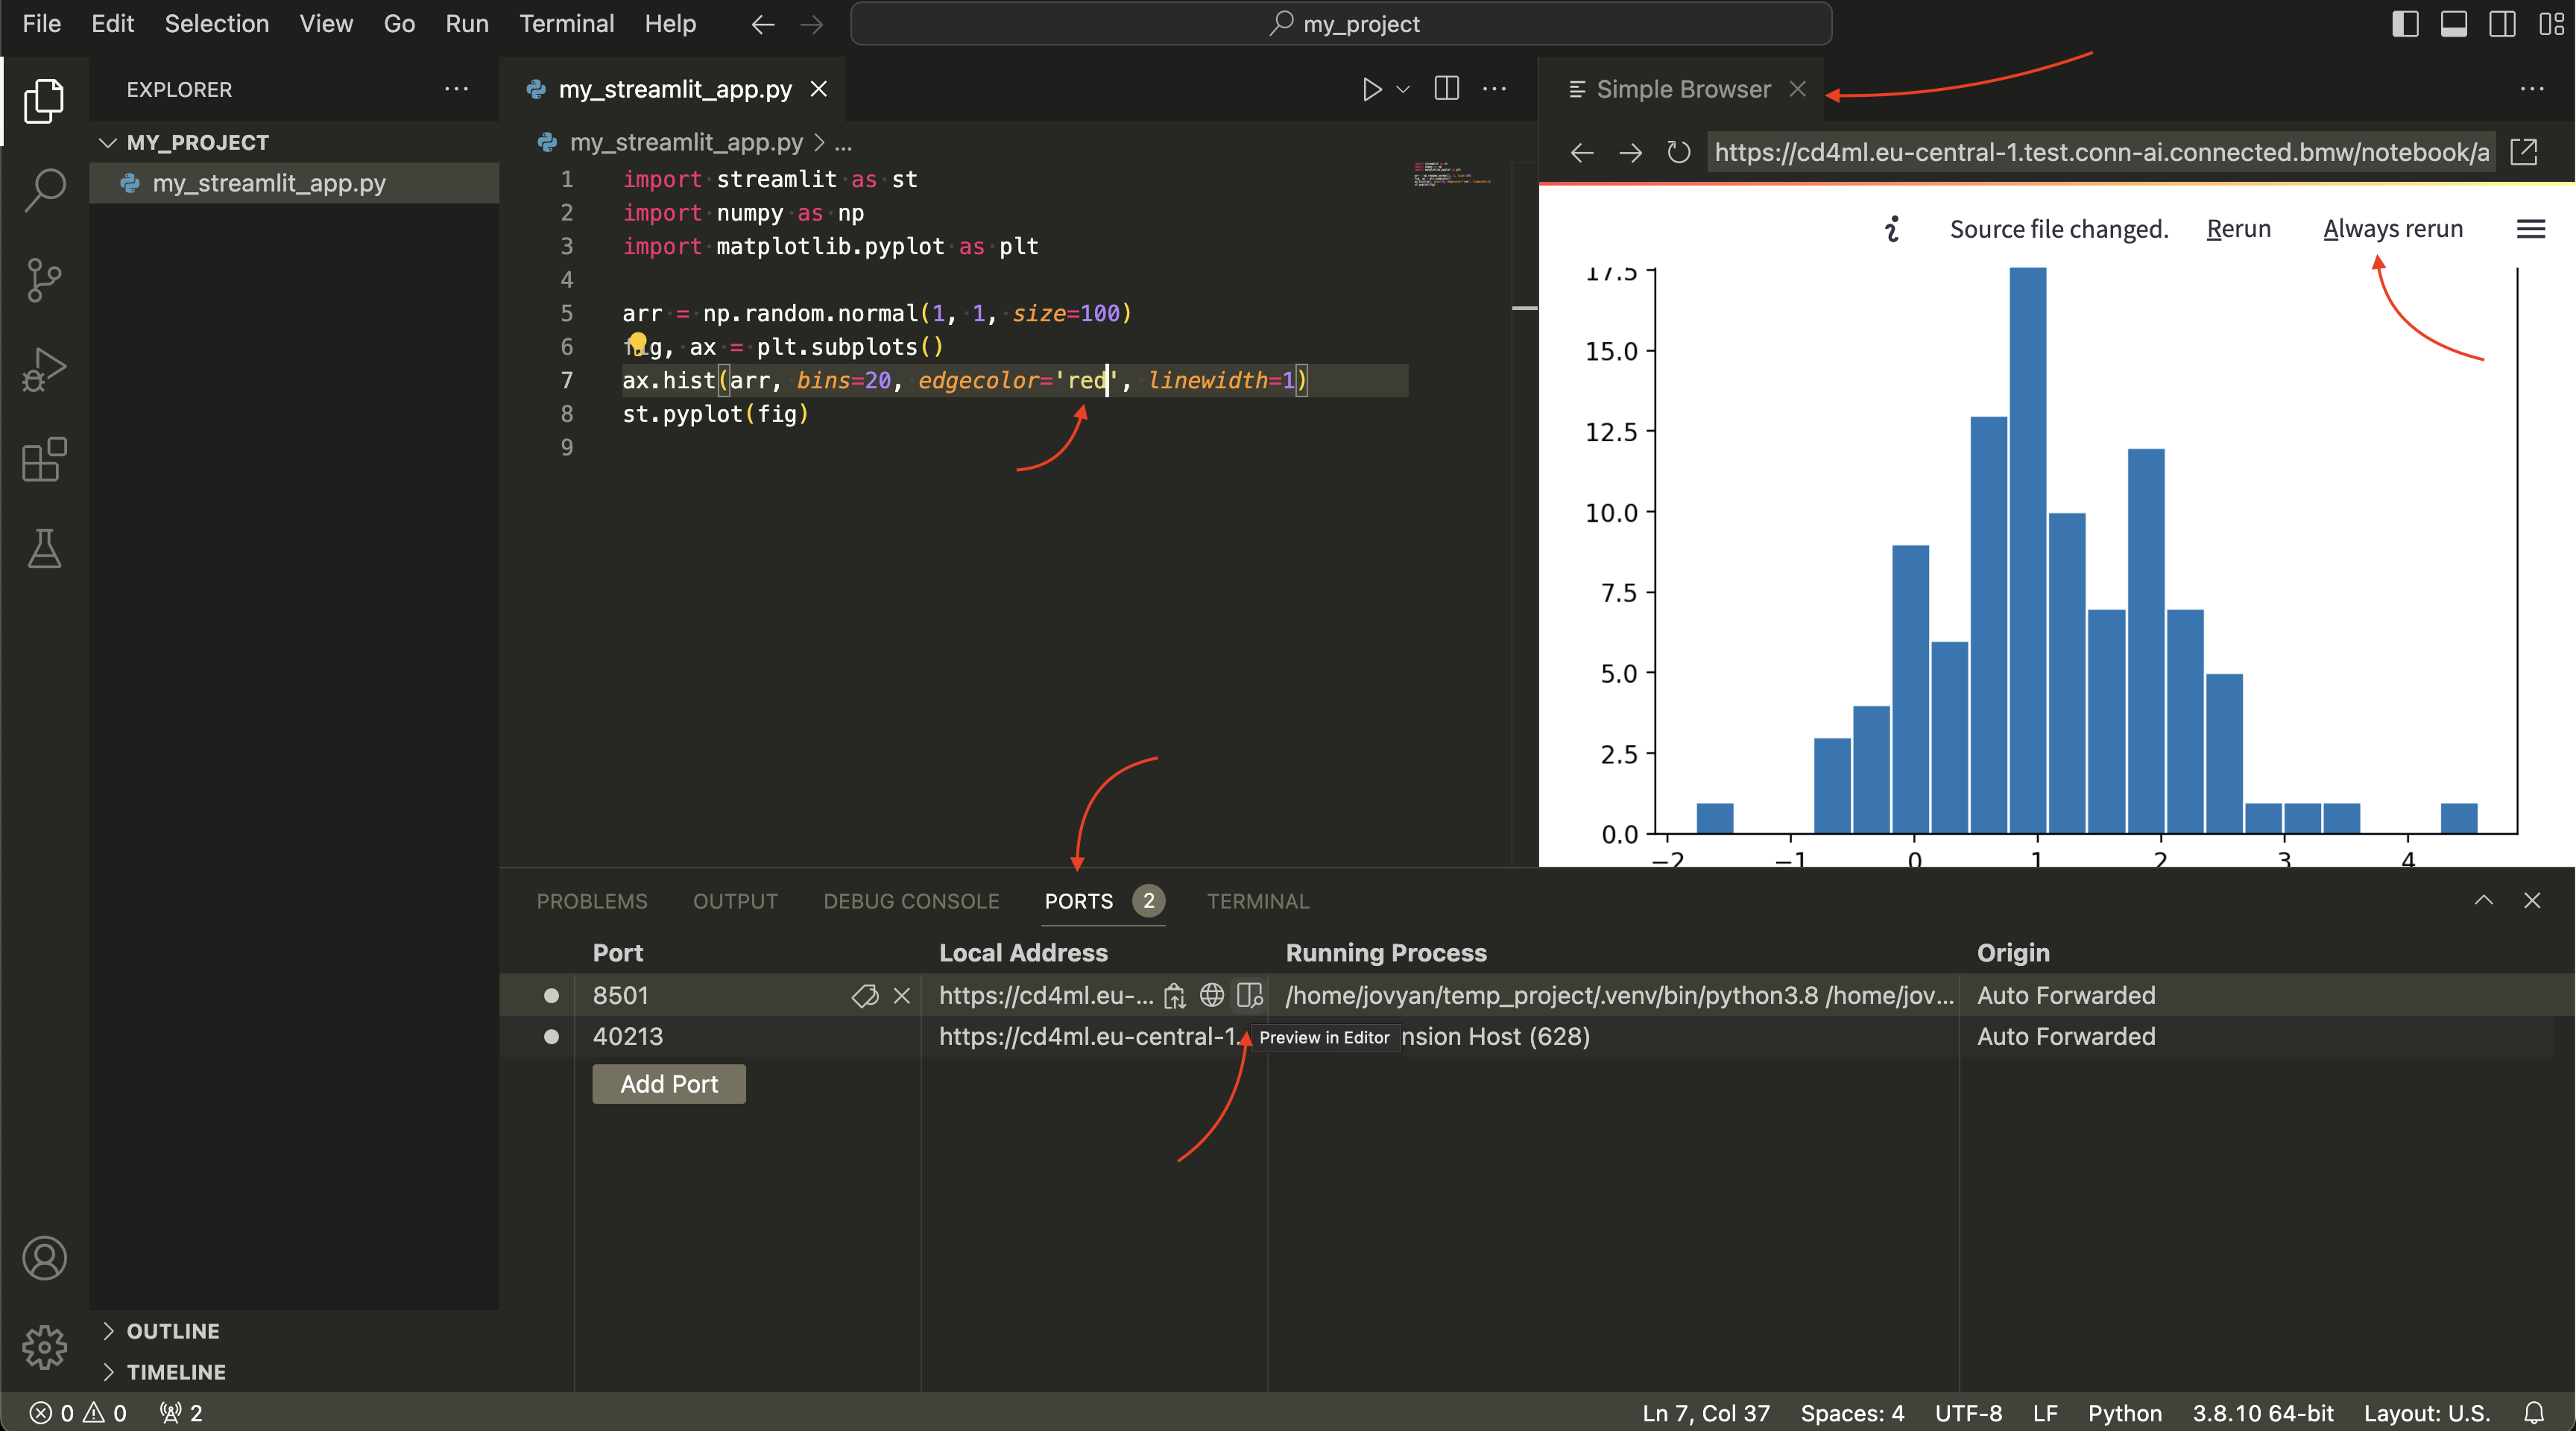
Having developed your app, refer to the example (conn-ai-demo / streamlit-demo) on deploying it to your Connected AI cluster, either from local or via GitHub CI/CD.
Access Streamlit App UI
After fulfilling the prerequisites mentioned here and following the steps in our example repository, you can access your dashboard either via Kubeflow UI, which will redirect you to these app endpoints:
Rest of the World:
https://streamlit.${REGION}.${ENVIRONMENT}.${PRODUCT_NAME}.connected.bmw/${PROFILE}/
Example: https://streamlit.eu-central-1.test.ai-lab.connected.bmw/astroboy/
China:
https://streamlit.${REGION}.${ENVIRONMENT}.${PRODUCT_NAME}.cv.bmw.com.cn/${PROFILE}/
Example: https://streamlit.cn-north-1.test.ai-lab-cn.cv.bmw.com.cn/astroboy/
Advanced Examples - Model Monitoring
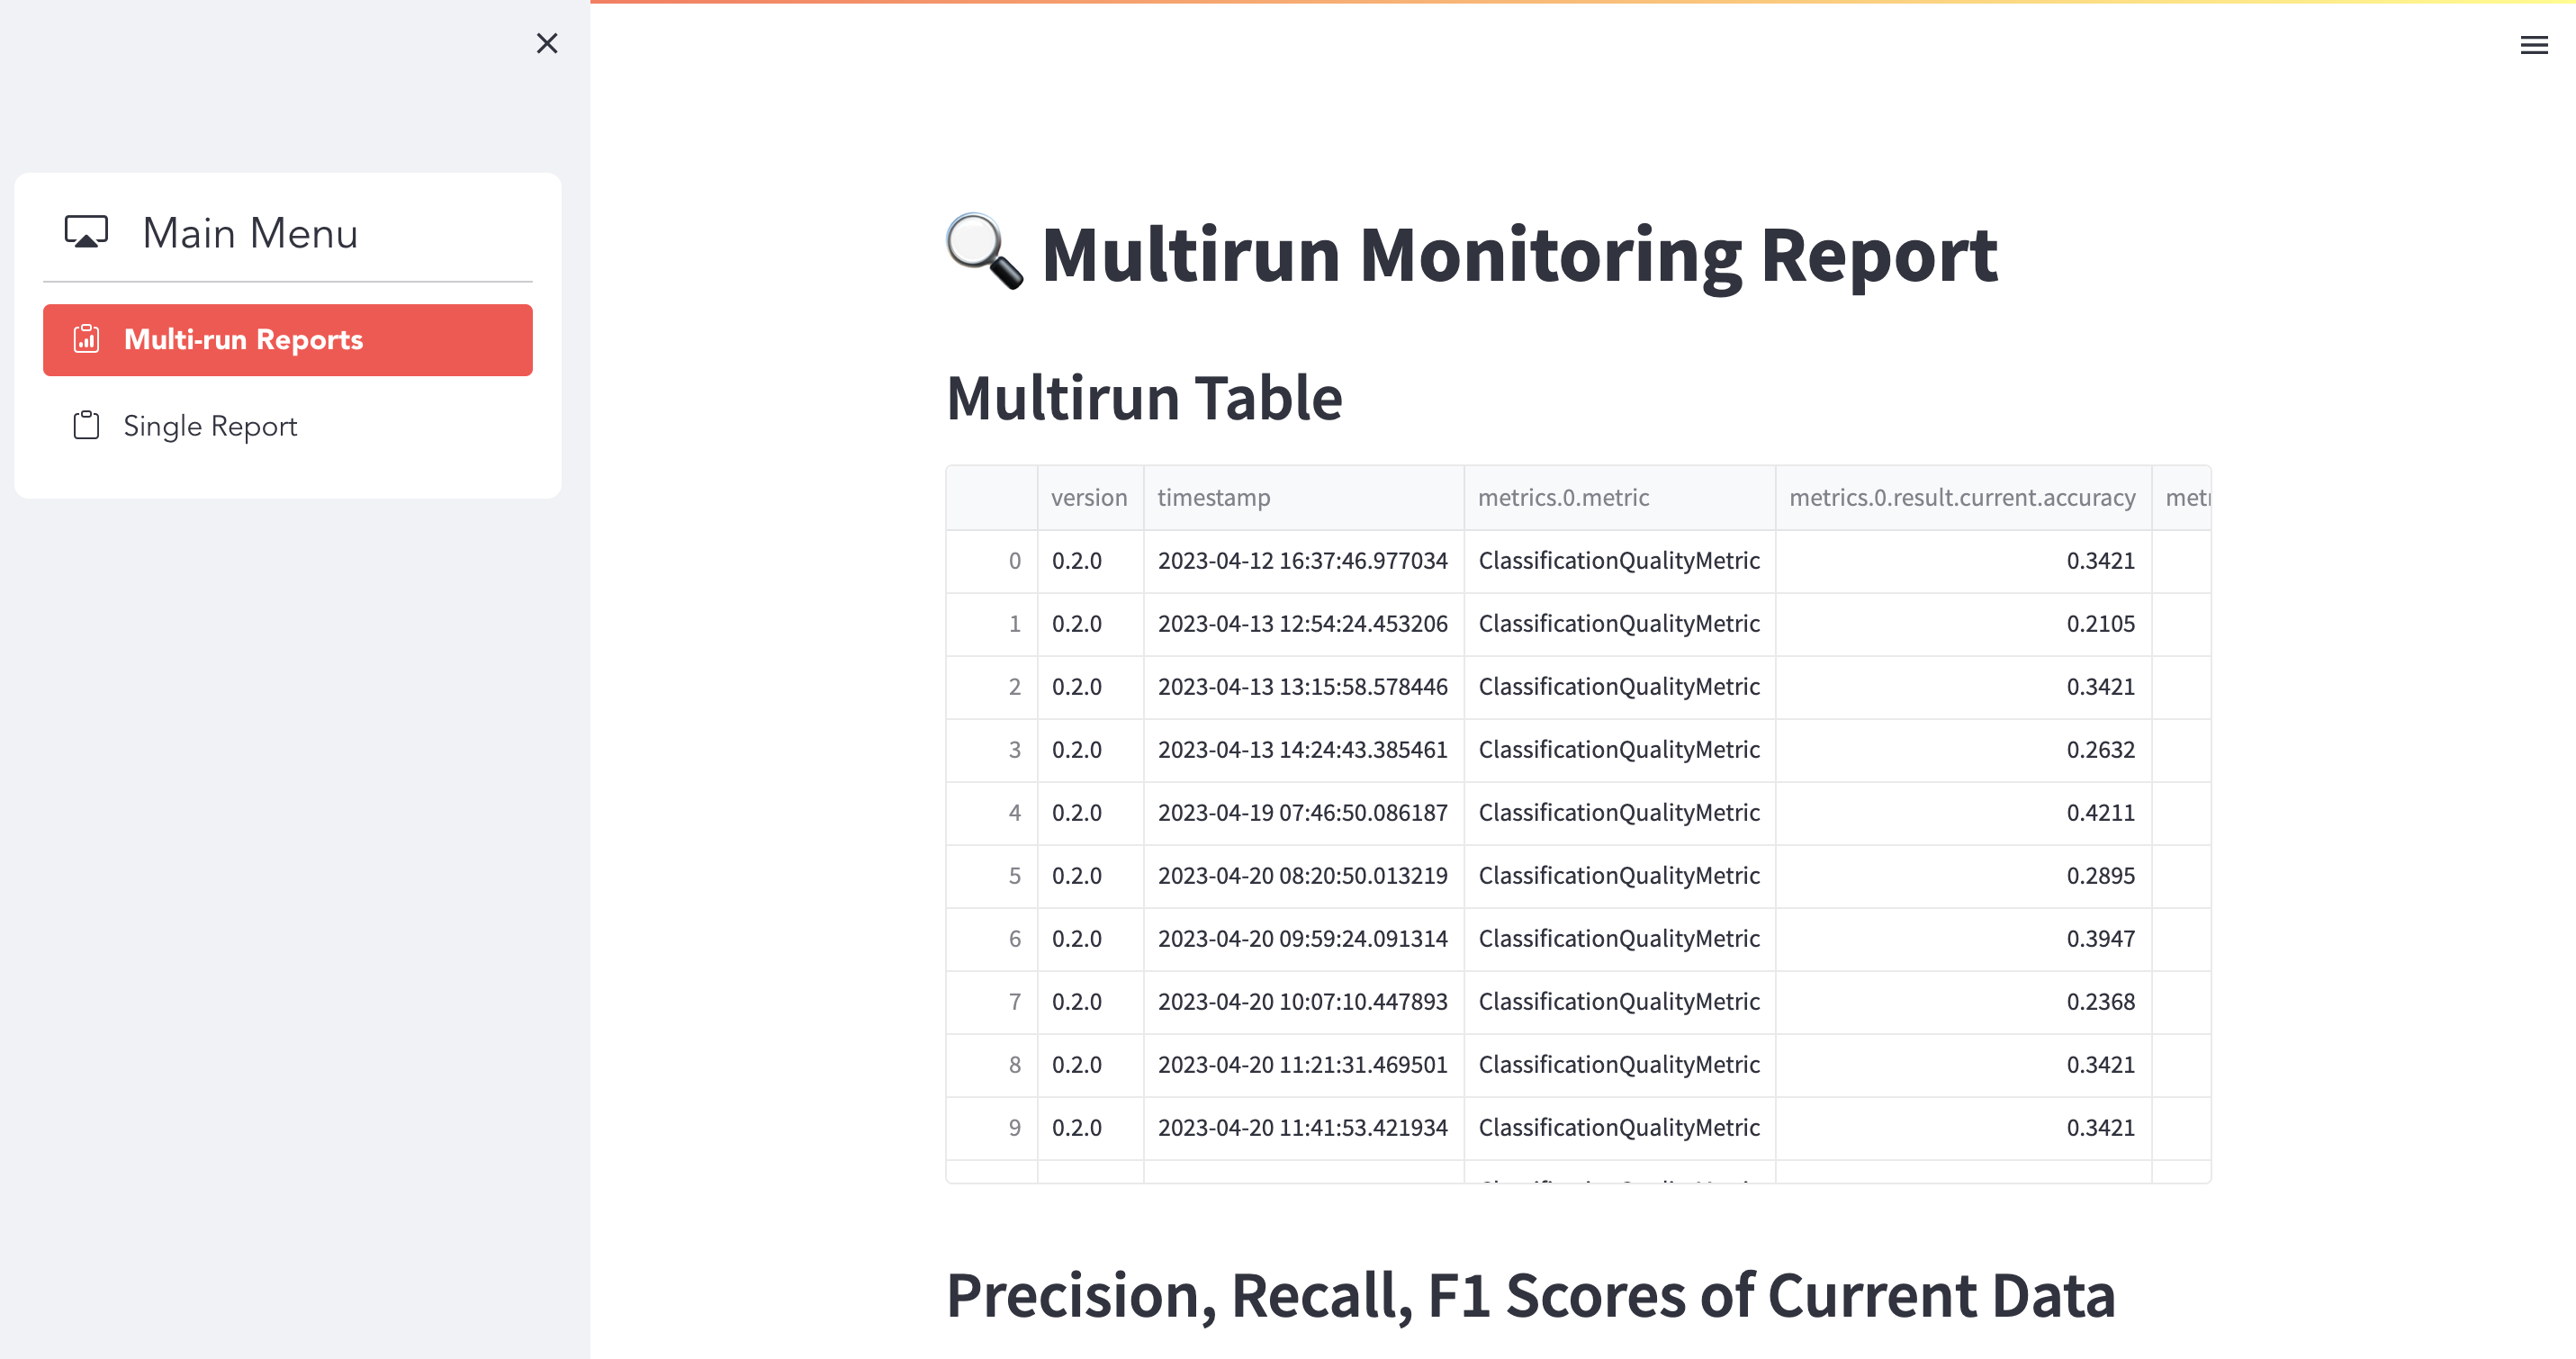
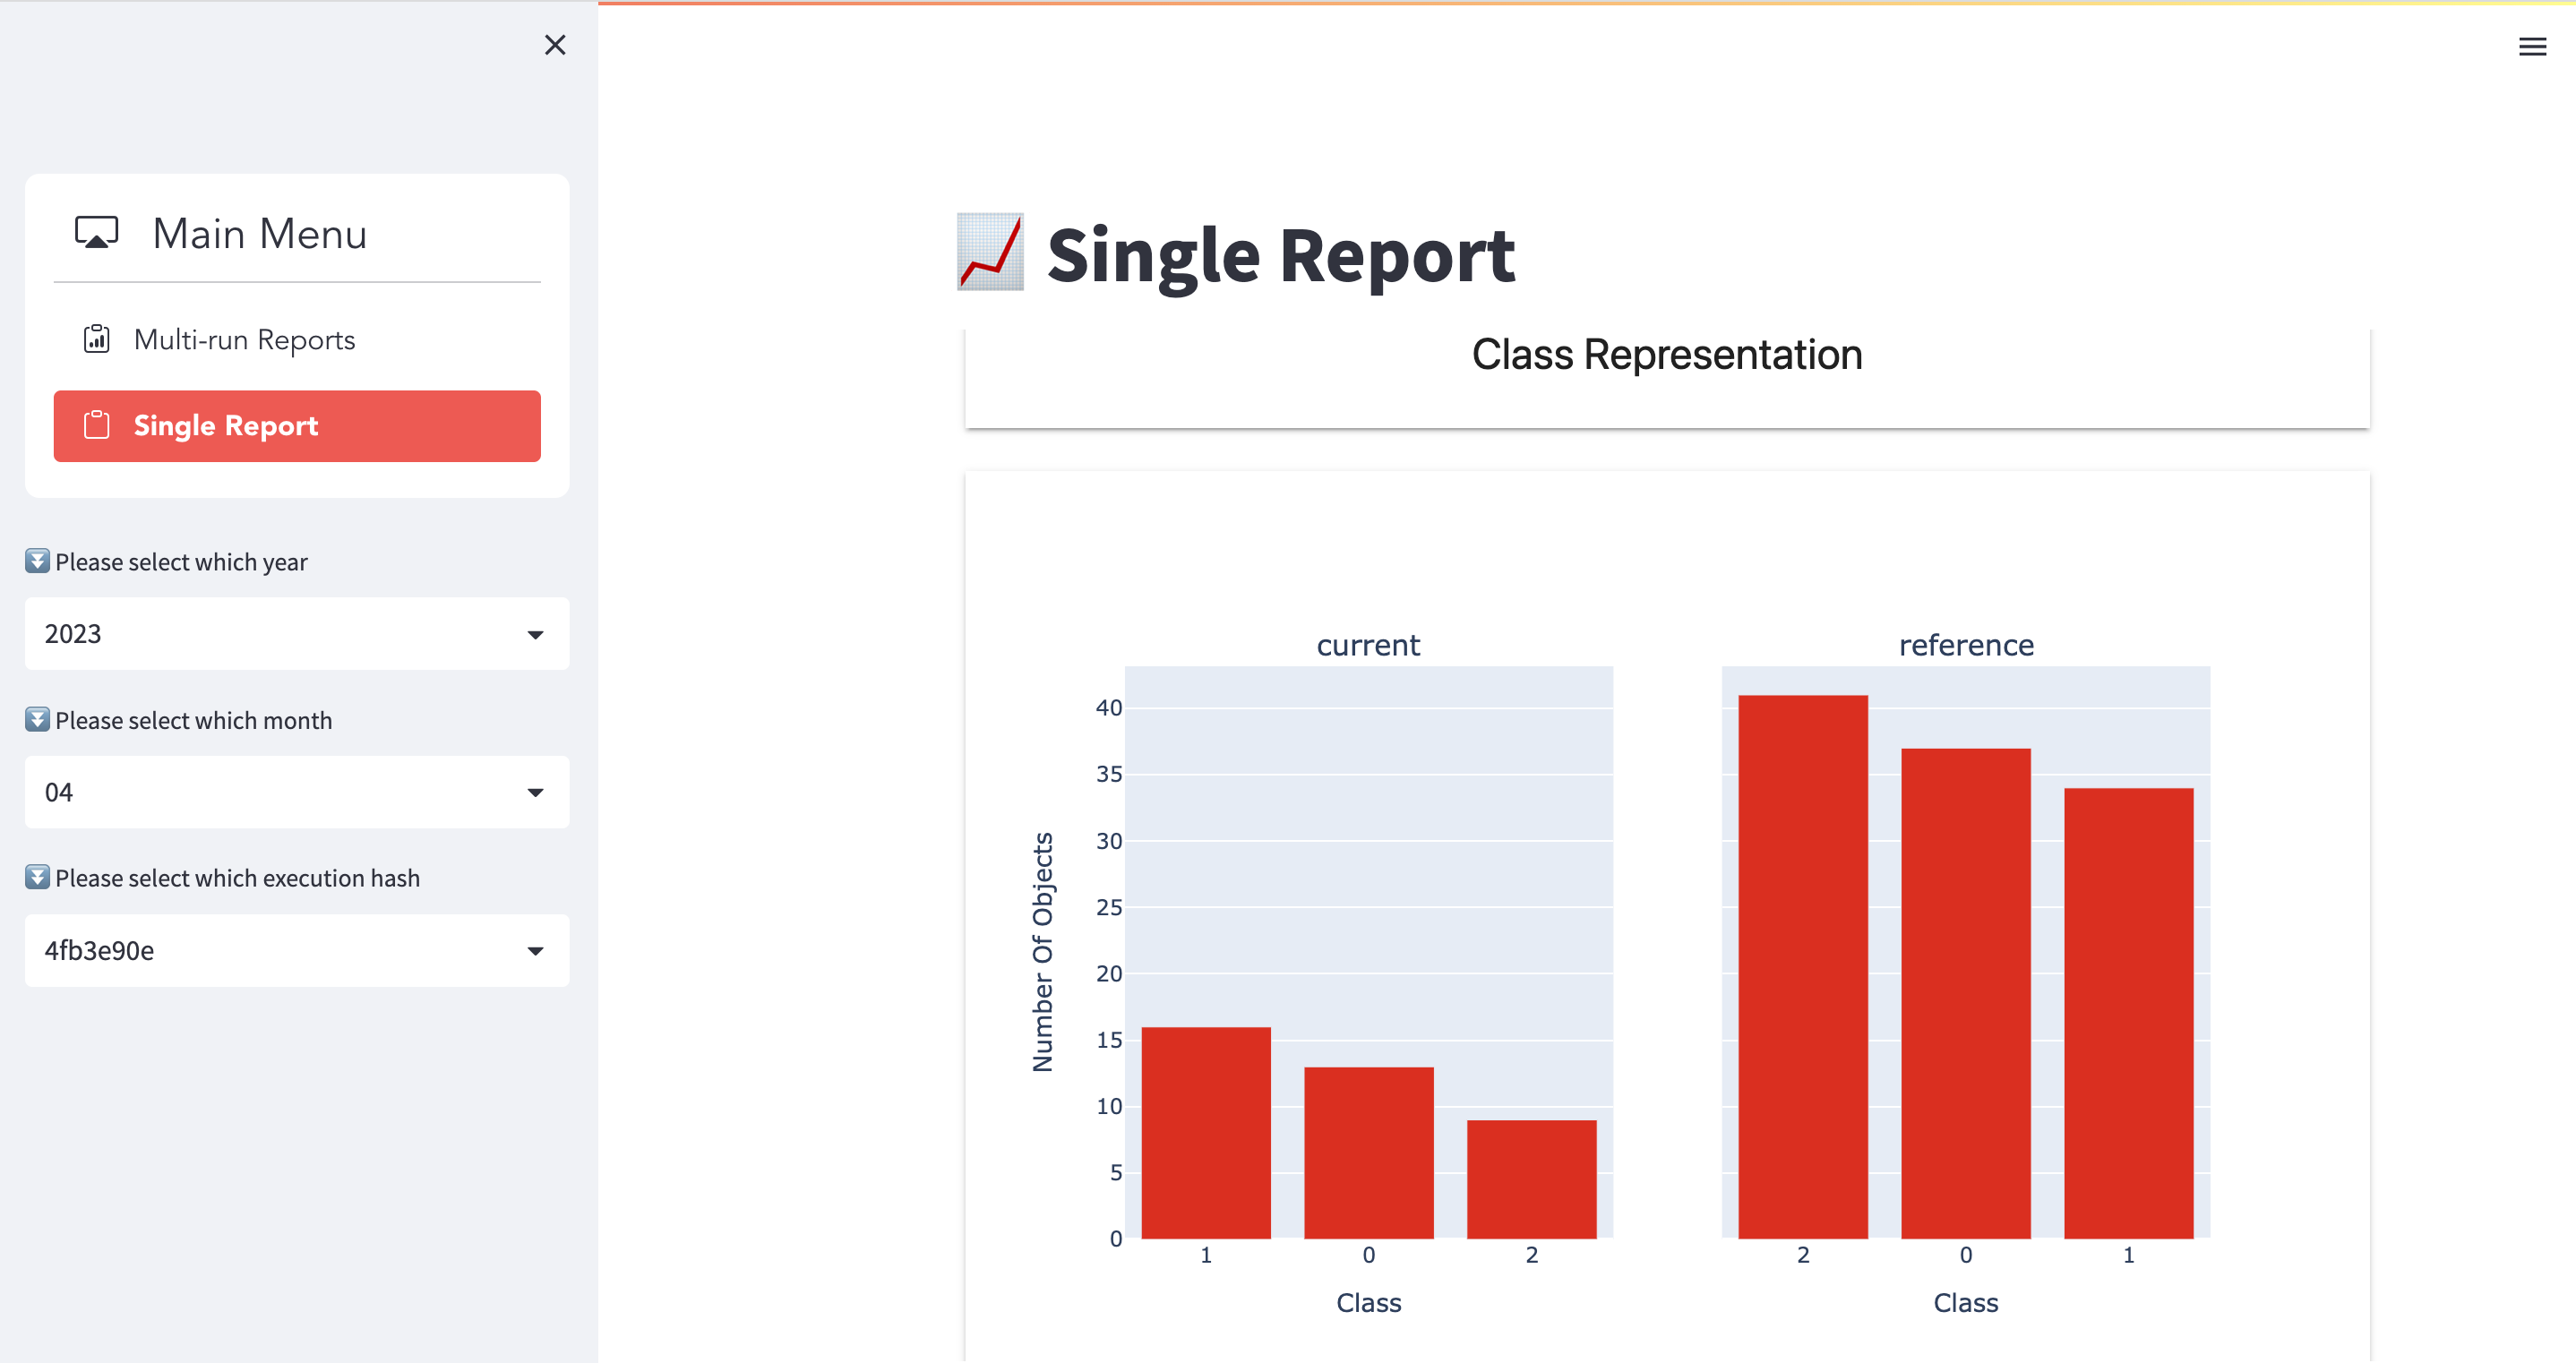
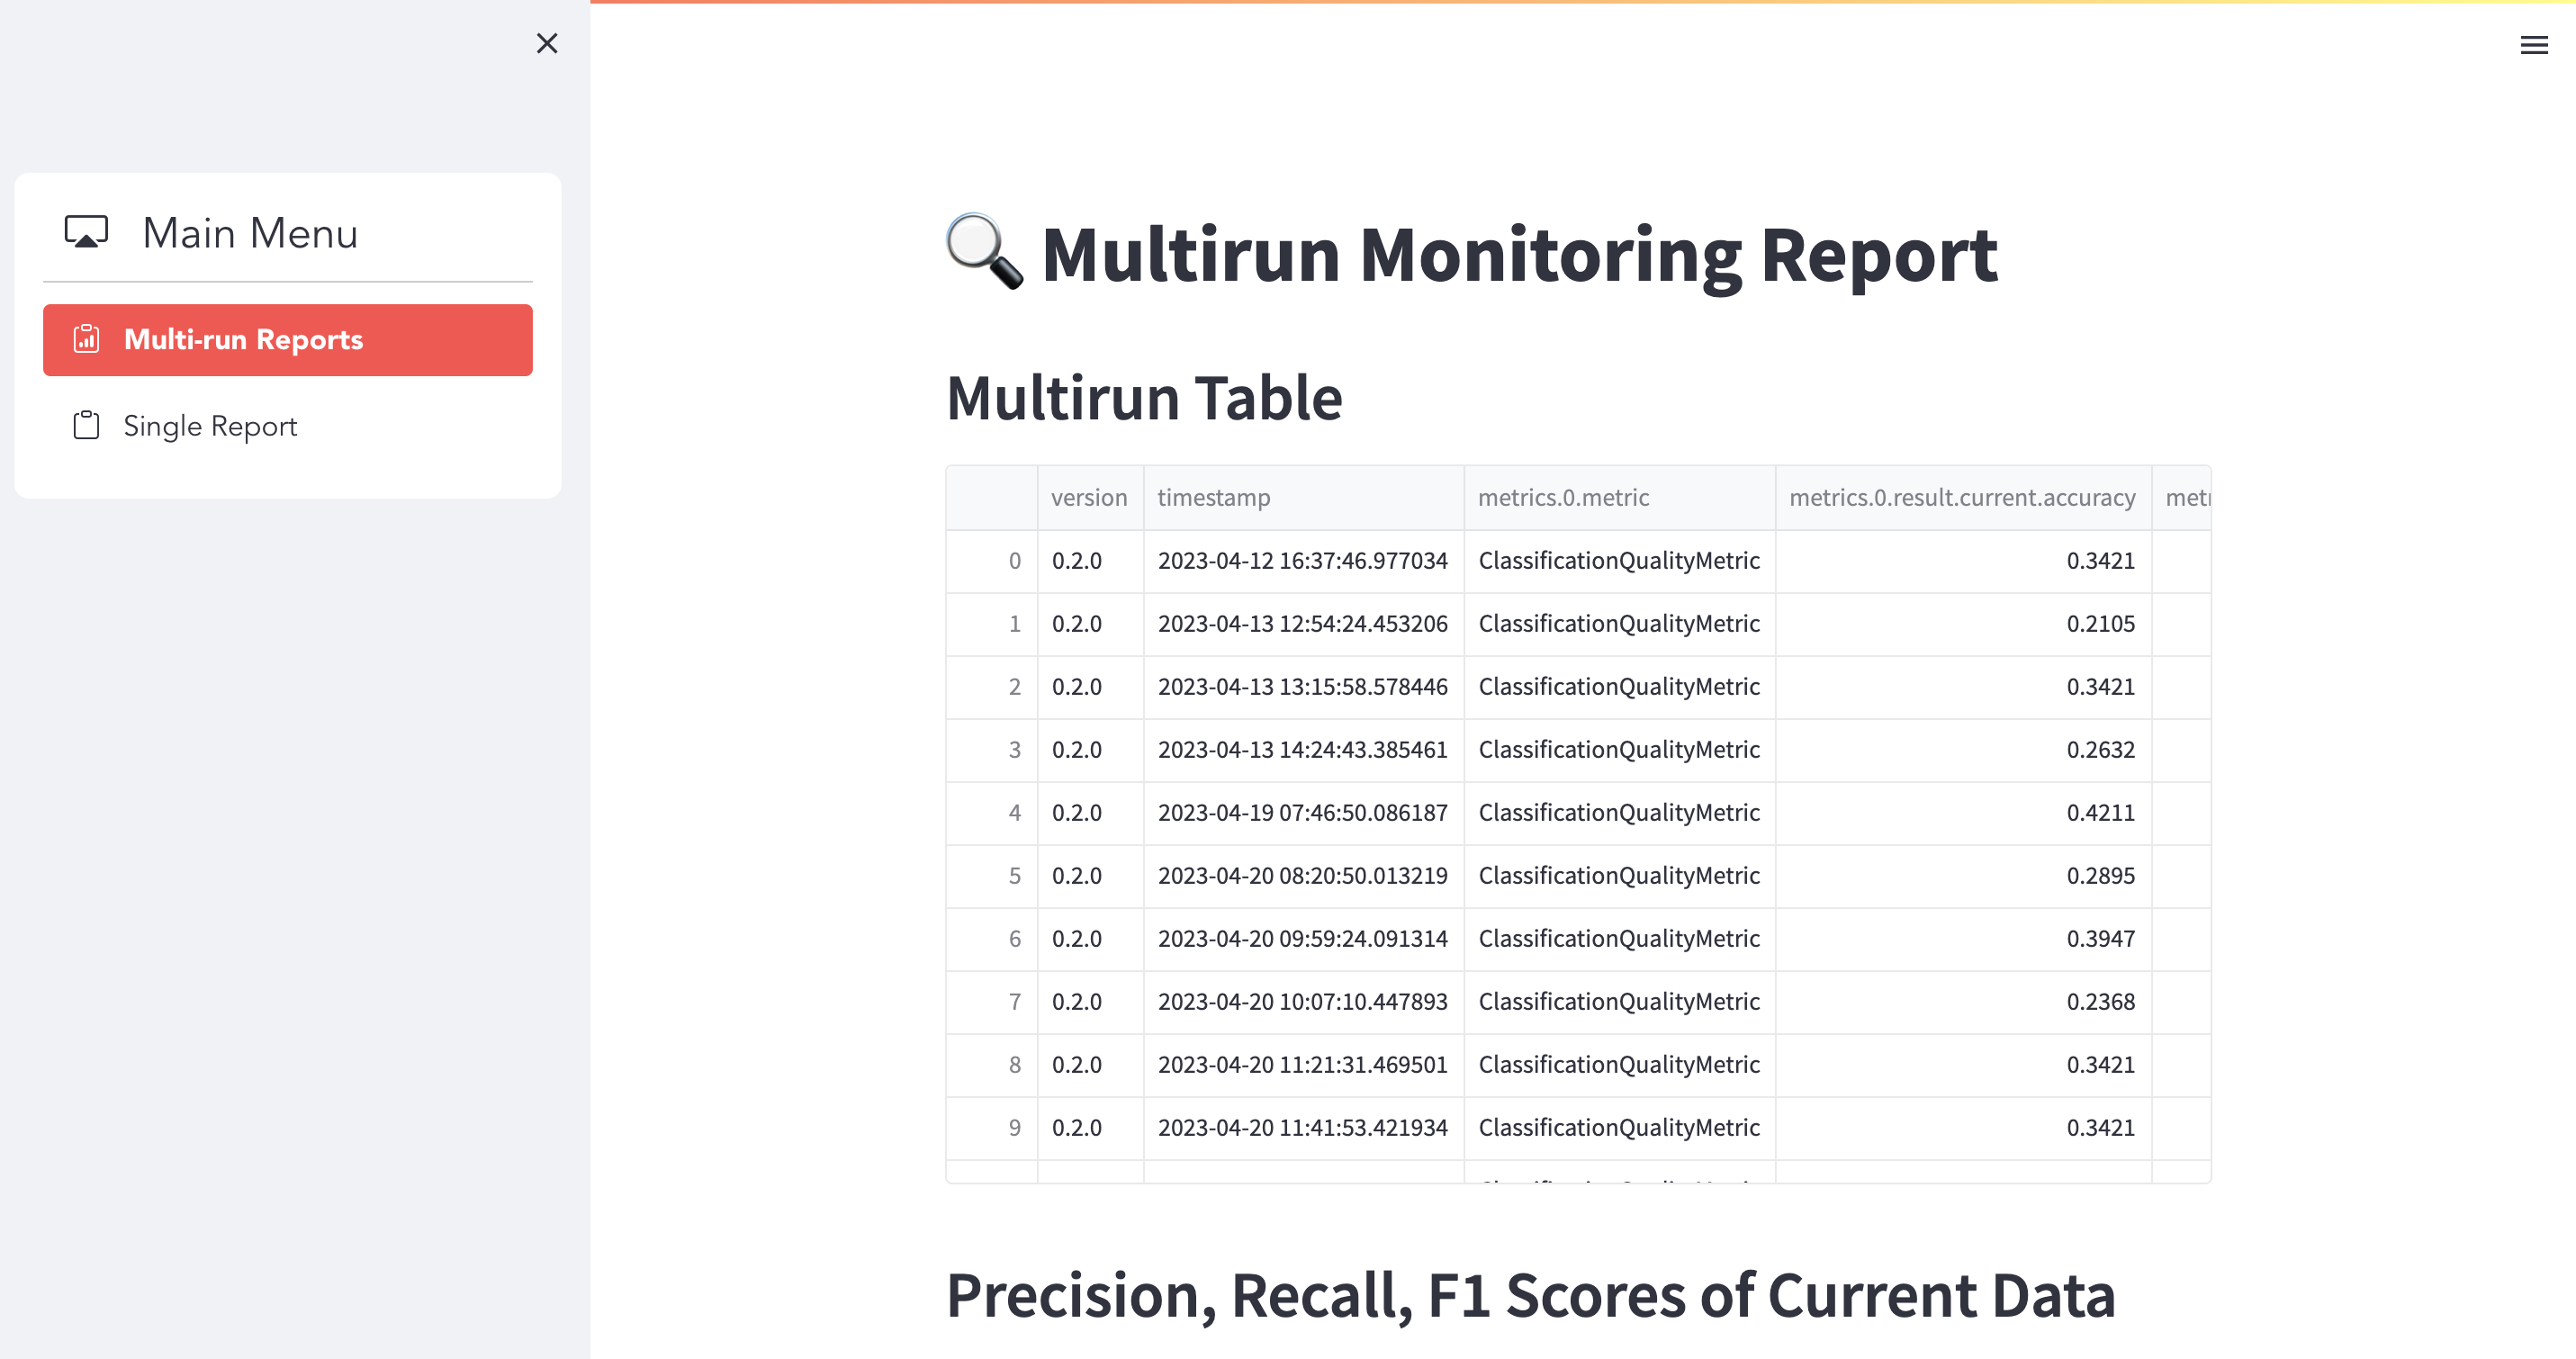
You can use Streamlit to visualize model monitoring metrics, that are created via plugging in dedicated steps into your existing Kubeflow pipeline, see Model Monitoring. By adding any of the outlined kubeflow components to your pipeline, particular files (html reports and parquet tables) will be uploaded to S3, that contain the model monitoring metrics. In the Streamlit example web app (see code here), you can see two tabs on the left bar. Each of the sub-pages makes use of the model monitoring results.
- Multi-run Reports retrieves the "multi-run" parquet file from S3, where all model monitoring metrics across all the previous runs (aka. timestamps) are stored.
- Single Report makes it easy to access model monitoring html reports generated for a single run. You can fetch a specific report based on the dates and the execution hash.
Developing Streamlit Dashboard on CAIP VS Code Server
Prerequisites
- Have your VS Code Server Notebooks provided by CAIP ready. If you want to test everything locally not from VS Code, you could also refer to the README.md.
- You have run several kubeflow pipelines runs with model monitoring components. If you haven't, please take a look on Model Monitoring, where has step-by-step guides to add different model monitoring components to your pipeline.
Important: Please run some pipelines before performing below commands, otherwise the report will get errors as there isn't any files in the S3 bucket.
Repository Structure
Below is the overall structure of the demo repo connected-ai / data-visualization:
data-visualization/
├── .github/                    # CI/CD workflow for hosting the app on CAIP
├── images/                     # Images used in README
├── streamlit_app/             # The Python script where you edit your visualization on the dataset
├── .gitignore
├── README.md                  # Guidelines on how to use the repo
└── renovate.json              # Script for checking outdated dependencies on GitHub
Create Your Streamlit App for Model Monitoring
Step 1: Clone the Repo and Install Requirements
Inside the VS Code server, please open the integrated terminal and run the following commands:
git clone https://bmw.ghe.com/connected-ai/data-visualization.git
cd streamlit-app/monitoring-report-dashboard
pip install .
When you git clone the repo, there will be a pop-up window above asking you for your GitHub PAT.
Step 2: Modify the Environment Variables Inside the App
Inside the app, we set up several environment variables to access the monitoring reports from S3 properly, see here. Please adjust them based on your use case.
S3 bucket access configuration sample code:
MONITORING_PIPELINE_NAME = "data-quality-monitoring-int-test"
PRODUCT_NAME = "ai-lab"
PROFILE = "ai-hworld"
REGION = "eu-central-1"
ENVIRONMENT = "test"
BUCKET = f"cd4ml-{PRODUCT_NAME}-{REGION}-{ENVIRONMENT}-{PROFILE}"
Step 3: Run the App
In the terminal, you can run:
streamlit run app.py
Step 4: Visualize the Results
Once the code is executed, VS Code will automatically start port-forwarding and by clicking "Open in Browser" you will be able to preview your dashboard in a browser. You can also navigate to the "Port" tab and click on the "Preview" button, which will display the dashboard straight in VS Code. When changing your code, then Streamlit detects the changes and asks you to rerun the dashboard. You can choose to "Always rerun" for interactive dashboard development.
Query Glue Tables & Parquet Files - Advanced Example
This example provides instructions on how to create and run dashboards on Streamlit by reading parquet files indexed as Glue tables using SQL queries on Amazon Athena. This application requires specific AWS IAM permissions to work properly in your environment.
If you have no previous experience, you can refer to the demo repository data-visualization/streamlit-app/athena-glue-table and run the example app.py.
Prerequisites
You need to have at least the following permissions added to your AWS IAM role or user permissions:
s3:GetObjects3:PutObjectathena:List*athena:Get*athena:*QueryExecutionec2:DescribeRegionskms:Decryptkms:Encrypt
Important Observation Notes
- Streamlit is primarily a visualization framework - It's built to be used as Python applications to create reports and dashboards on top of pre-processed data consumed from multiple sources.
- Avoid data processing in Streamlit - It's not recommended to manipulate or process data inside Streamlit apps. Any kind of data processing should be done prior to Streamlit report rendering to prevent resource usage problems that can generate availability issues on the platform.
- AWS Knowledge Required - This example assumes you have knowledge about AWS data services like S3, Glue, and Athena to respectively store, index/aggregate, and query data to be visualized on Streamlit.
Running/Modifying Streamlit Athena/Glue Example Dashboard on CAIP VS Code Server
Development Prerequisites
Developing Streamlit dashboards is straightforward. You can use any integrated development environment (IDE), but we recommend using the VS Code Server Notebooks provided by CAIP. When running inside the VS Code Server, you don't have to think about AWS permissions and will directly have access to all your regular data sources.
Create Your First Streamlit App
Step 1: Clone the Repository and Install Requirements
Inside the VS Code server, open the integrated terminal and run the following commands:
git clone https://bmw.ghe.com/conn-ai/data-visualization.git
cd streamlit-app/athena-glue-table
pip install .
Step 2: Run the App
streamlit run app.py
Step 3: Visualize the Results
Once the code is executed, VS Code will automatically start port-forwarding. By clicking "Open in Browser", you will be able to preview your dashboard in a browser. You can also navigate to the "Port" tab and click on the "Preview" button, which will display the dashboard straight in VS Code. When changing your code, Streamlit detects the changes and asks you to rerun the dashboard. You can choose to "Always rerun" for interactive dashboard development.
For detailed instructions, refer to the README.md section in the repository.
Running Streamlit Example on a Cluster
Please follow the instructions described in "Test it on the cluster" to properly assign the image tag 671994827252.dkr.ecr.eu-central-1.amazonaws.com/conn-ai/streamlit-athena-glue-table:latest in the products.yaml file on the namespace of your choice, roll it out, and access Streamlit on your product cluster.
Browsing Through Streamlit Athena/Glue Dashboards and Features
Once you can access Streamlit in your browser (either running locally or on a cluster), you can start to explore the built-in dashboards and features:
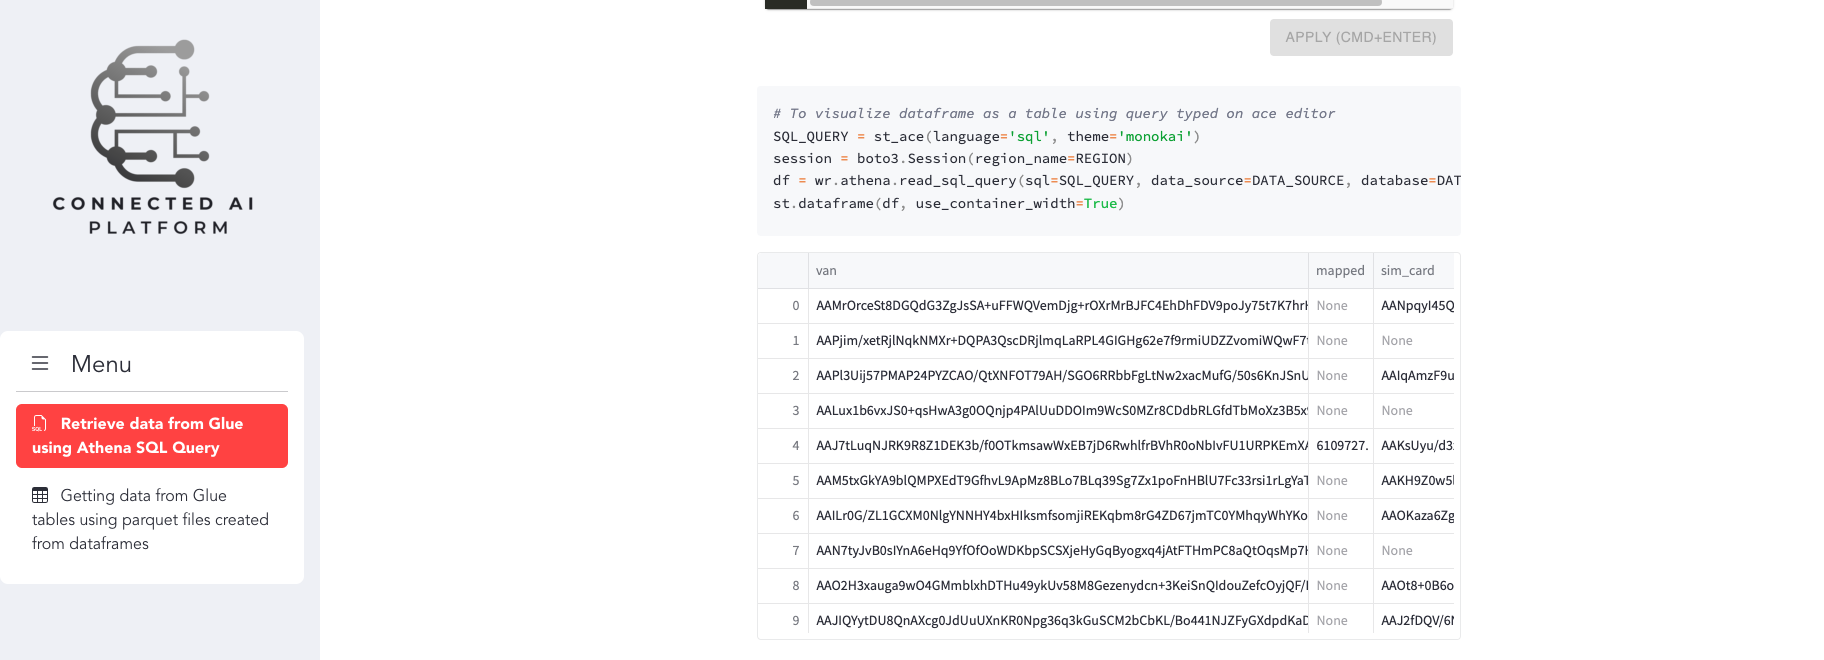
1. Receiving Data from Glue using Athena SQL Query
You can choose Athena parameters and write SQL queries to the specified Athena database/table destination and get a dataframe representation of the results on your screen. You can also choose a timestamp column and a column to assign as a metric to render a line chart representing metric values during a timeframe.
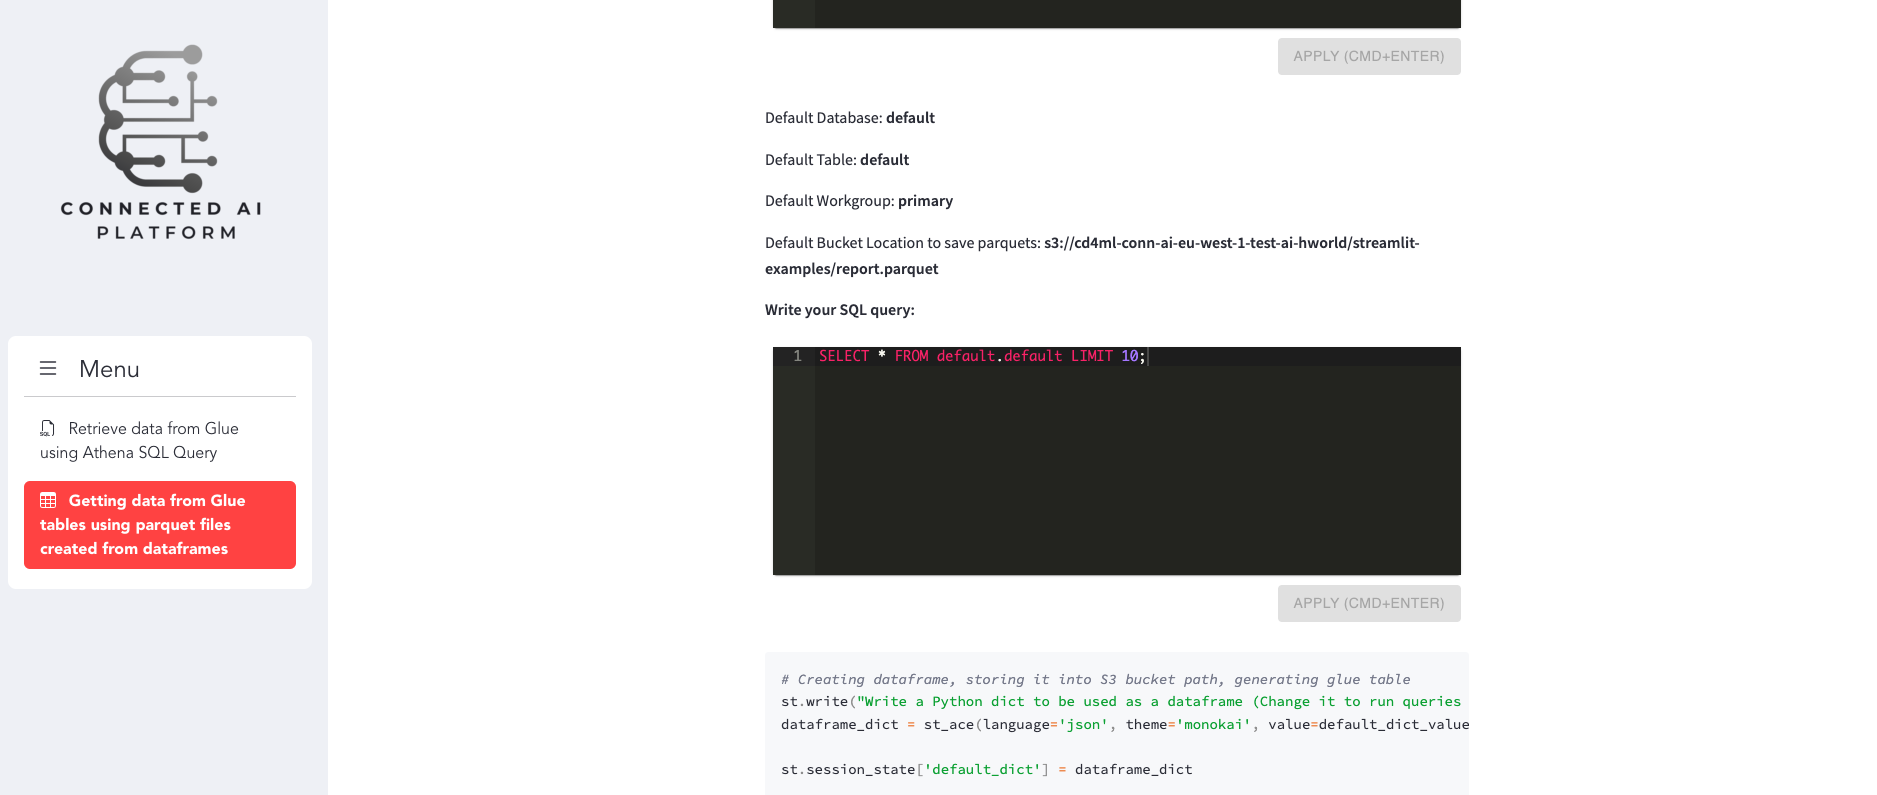
2. Getting Data from Glue Tables using Parquet Files Created from DataFrames
You can write down a Python dictionary to be converted into a parquet file and stored on S3. Then a Glue database and table are created/updated with names default and default respectively from the S3 location where the parquet file was stored. You can then submit SQL queries to the newly created table and get dataframe representations of the results. After creating your database/table, you can also go back to the SQL Query tab to render line charts from it.
S3/Parquet - Reports on Parquet Files
This example provides instructions on how to create and run dashboards on Streamlit by reading parquet files stored on S3 and visualizing them by submitting SQL queries on Amazon Athena. This application requires specific AWS IAM permissions to work properly in your environment.
If you have no previous experience, you can refer to the demo repository data-visualization/streamlit-app/s3-parquet and run the example app.py.
Prerequisites
You need to have at least the following permissions added to your AWS IAM role or user permissions:
s3:GetObjects3:PutObjectathena:List*athena:Get*athena:*QueryExecutionec2:DescribeRegionskms:Decryptkms:Encrypt
Important Observation Notes
- Streamlit is primarily a visualization framework - It's built to be used as Python applications to create reports and dashboards on top of pre-processed data consumed from multiple sources.
- Avoid data processing in Streamlit - It's not recommended to manipulate or process data inside Streamlit apps. Any kind of data processing should be done prior to Streamlit report rendering to prevent resource usage problems that can generate availability issues on the platform.
- AWS Knowledge Required - This example assumes you have knowledge about AWS data services like S3, Glue, and Athena to respectively store, index/aggregate, and query data to be visualized on Streamlit.
Running/Modifying Streamlit S3-Parquet Example Dashboard on CAIP VS Code Server
Development Prerequisites
Developing Streamlit dashboards is straightforward. You can use any integrated development environment (IDE), but we recommend using the VS Code Server Notebooks provided by CAIP. When running inside the VS Code Server, you don't have to think about AWS permissions and will directly have access to all your regular data sources.
Create Your First Streamlit App
Step 1: Clone the Repository and Install Requirements
Inside the VS Code server, open the integrated terminal and run the following commands:
git clone https://bmw.ghe.com/conn-ai/data-visualization.git
cd streamlit-app/s3-parquet
pip install .
Step 2: Run the App
streamlit run app.py
Step 3: Visualize the Results
Once the code is executed, VS Code will automatically start port-forwarding. By clicking "Open in Browser", you will be able to preview your dashboard in a browser. You can also navigate to the "Port" tab and click on the "Preview" button, which will display the dashboard straight in VS Code. When changing your code, Streamlit detects the changes and asks you to rerun the dashboard. You can choose to "Always rerun" for interactive dashboard development.
For detailed instructions, refer to the README.md section in the repository.
Running Streamlit Example on a Cluster
Please follow the instructions described in "Test it on the cluster" to properly assign the image tag 671994827252.dkr.ecr.eu-central-1.amazonaws.com/conn-ai/streamlit-s3-parquet:latest in the products.yaml file on the namespace of your choice, roll it out, and access Streamlit on your product cluster.
Browsing Through Streamlit S3-Parquet Dashboards and Features
Once you can access Streamlit in your browser (either running locally or on a cluster), you can start to explore the built-in dashboards and features:
1. Multi-run Reports - S3 Parquet using Multiple Files
You can choose bucket parameters to search for multiple parquet files stored on a specific prefix and get a dataframe representation of the results on your screen. You can also choose a timestamp column and other metric columns to assign as series and render a line chart to represent metric values during a timeframe. This example assumes that you have one or more parquet files with the same schema stored on the chosen S3 bucket prefix.
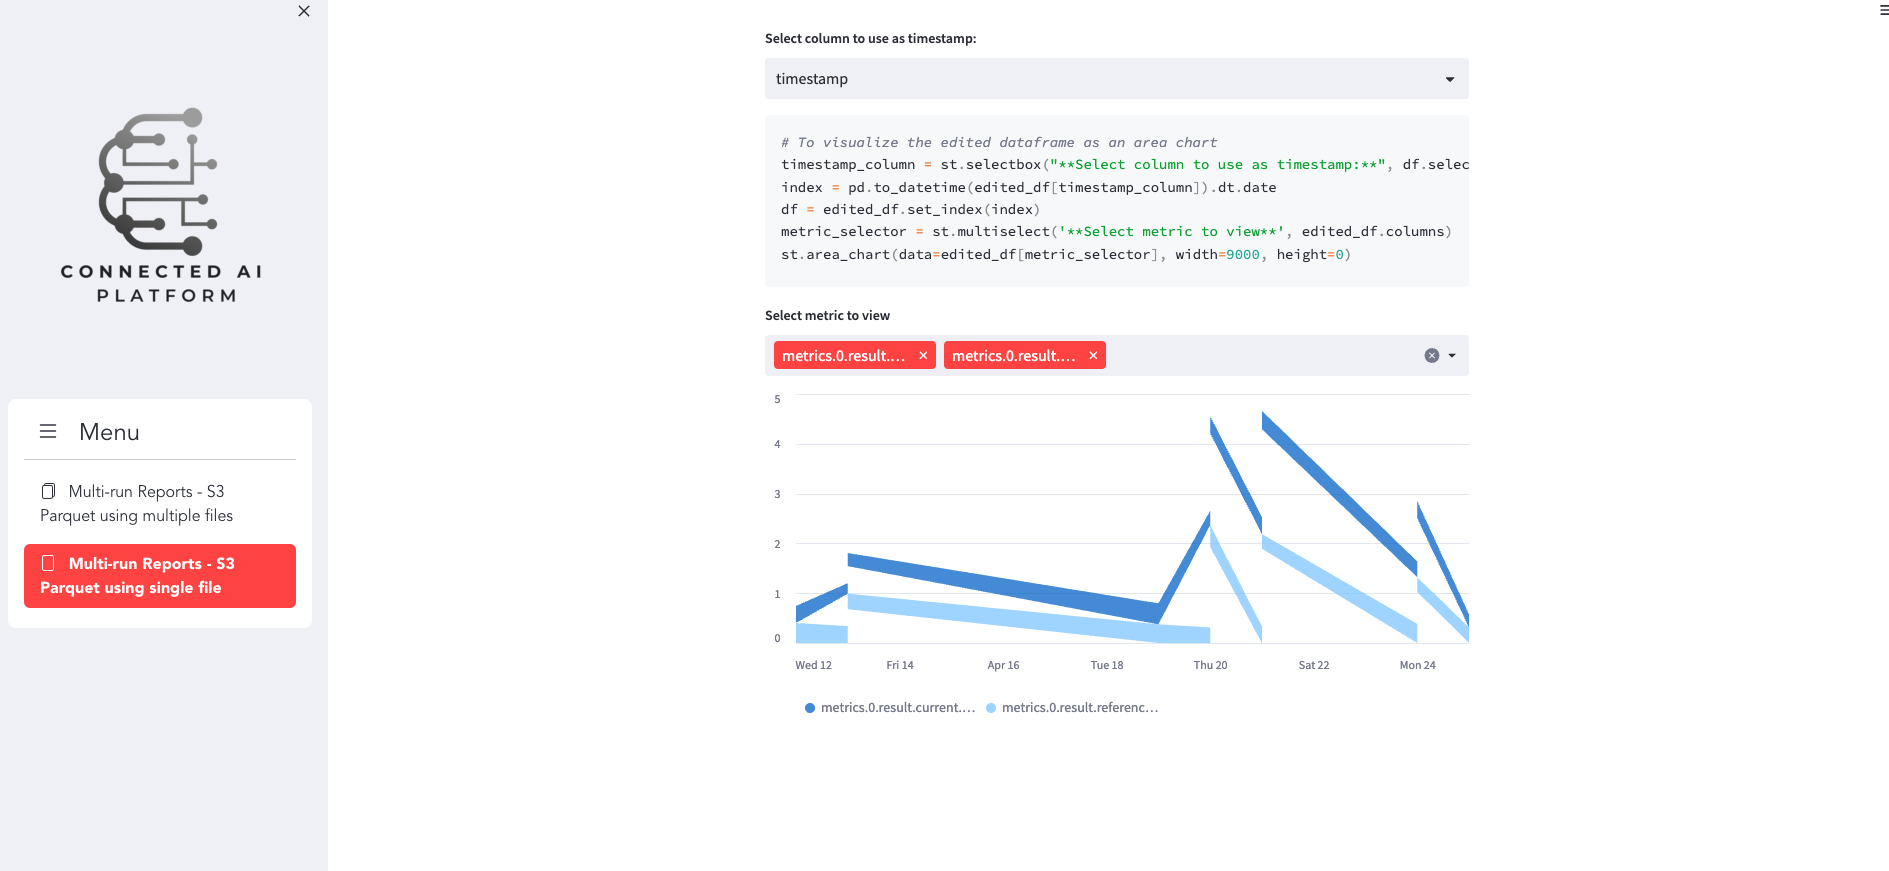
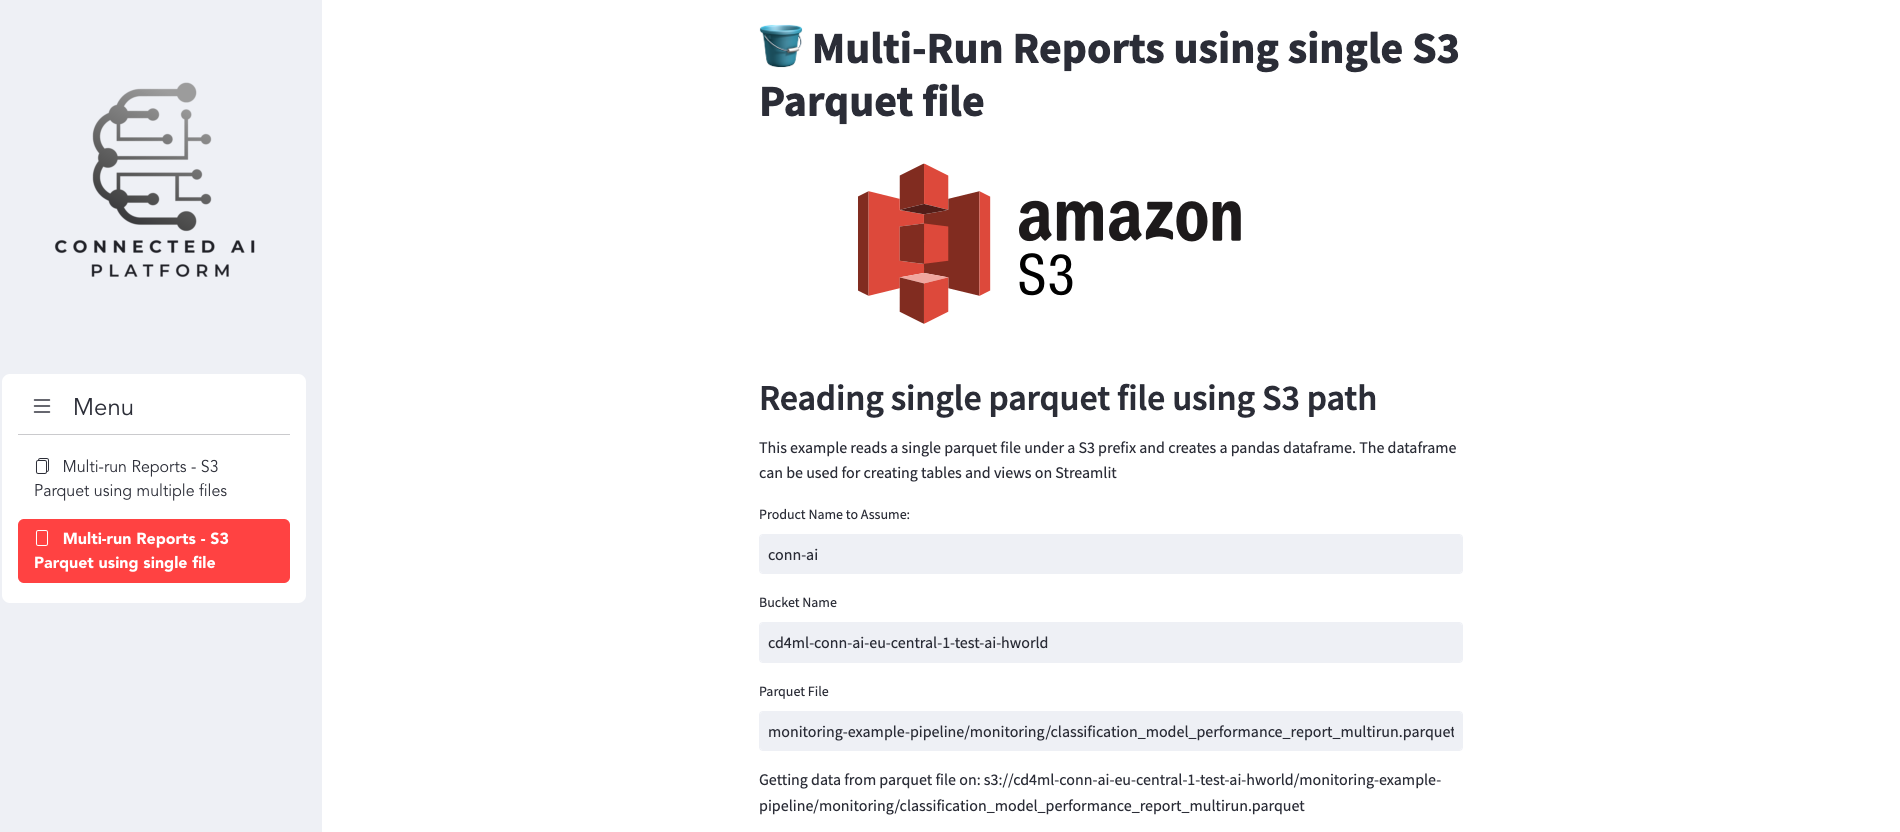
2. Multi-run Reports - S3 Parquet using Single File
You can choose bucket parameters to search for a single parquet file stored on a specific prefix and get a dataframe representation of the results on your screen. You can also choose a timestamp column and other metric columns to assign as series and render an area chart to represent metric values during a timeframe. This example assumes that you have one single parquet file on the chosen S3 bucket prefix.
Expose Streamlit to Product Non-Developers
Sometimes you might need to share Streamlit dashboards/apps with stakeholders or other people who are not product developers and don't have access to resources deployed by CAIP. To address this need, the Streamlit Helm chart provides configuration options to control user authentication and access.
Context
The Streamlit deployment includes Istio AuthorizationPolicies that enforce user authorization by default. To disable these policies or customize access control, a property in the values.yaml configuration file has been introduced:
- Streamlit 0.3.2 Helm chart version: Added the ability to expose Streamlit to everyone by disabling authentication on BMW WebEAM
- Streamlit 0.3.7 Helm chart version: Added feature allowing authentication to remain enabled while granting access to a specific list of users
For Everyone
As described in the Helm-based deployment migration guide, you can define Streamlit deployment properties in the values.yaml file. You can assign authentication.enabled as false to disable the authorization process as shown in the example below:
productName: "ai-lab"
region: "eu-central-1"
environment: "test"
accountID: "671994827252"

image:
  repository: 671994827252.dkr.ecr.eu-central-1.amazonaws.com/conn-ai/streamlit
  pullPolicy: Always
  tag: "1.0.2"

force_restart: false

# Enable/Disable authentication
authentication:
  enabled: false        # <-- ASSIGN FALSE TO OPEN STREAMLIT ACCESS TO EVERYONE
  external_users: []

port: 8501

replicaCount: 1

env: {}

resources:
  limits:
    cpu: 1
    memory: 2Gi
  requests:
    cpu: 100m
    memory: 745Mi
When you open the Streamlit URL after running the GitHub Workflow to upgrade the Helm installation, your Streamlit app will be accessible to everyone without requiring an authorization session cookie, proving that the request wasn't authenticated on WebEAM.
For Specific Set of Users
Disabling authentication completely is sometimes too aggressive and unsafe, so we included an option where it's possible to grant access to a specific set of users (instead of everyone).
To grant access to a specific set of users, you need to specify the list of users in the external_users field in the authentication section:
# -- product name registered on Connected AI Platform
productName: "ai-lab"
# -- AWS region
region: "eu-central-1"
# -- AWS environment
environment: "test"
# -- AWS Account ID
accountID: "671994827252"

# -- Streamlit pod Image settings
image:
  repository: 671994827252.dkr.ecr.eu-central-1.amazonaws.com/conn-ai/streamlit
  pullPolicy: Always
  # Overrides the image tag whose default is the chart appVersion.
  tag: "1.0.2"

# -- helm only restarts pods if the content has changed; forcing a restart can be used for situations where we don't change any input value and use image.tag = "latest" to trigger a redeployment of the pod
force_restart: false

# -- expose Streamlit app to everyone -> this means, that viewers are not forwarded to BMW WebEAM when opening the Streamlit app
authentication:
  enabled: true
  # -- Add emails as allowed external users on your Streamlit instance (all e-mails are case insensitive)
  external_users:
    - test@ctw.bmwgroup.com
    - test@batw.bmwgroup.com
    - UPPERCASE_TEST@CTW.BMWGROUP.COM
    - CamelCase@ctw.bmwgroup.com

# -- Streamlit app listening port
port: 8501

# ############
# Pod Settings
# ############

# -- Number of pods to launch simultaneously
replicaCount: 1

# -- Pod environment variables
env: {}

# -- Pod resources definition
resources:
  limits:
    cpu: 1
    memory: 2Gi
  requests:
    cpu: 100m
    memory: 745Mi
Key Features
- Case Insensitive Email Matching: All email addresses in the
external_userslist are treated as case insensitive - Flexible Authentication: Choose between completely open access or restricted access to specific users
- BMW WebEAM Integration: Maintains integration with BMW's authentication system when needed
- Helm Chart Configuration: Easy configuration through standard Helm values files