Observability
Overview
The Connected AI Platform provides comprehensive observability capabilities through two main tools: Grafana for data visualization and dashboards, and CDLS for centralized logging. These tools enable users to monitor, analyze, and debug their machine learning pipelines and applications effectively.
Kibana
Kibana is part of the Elastic stack. CDLS uses Kibana as frontend for searching and viewings of log events. A free online course for the Kibana product is available from https://www.elastic.co/de/training/kibana-fundamentals.
How to Access to Kibana
Request Group Access to CAIP CDLS
Application and microservice logs are organized in groups. You must apply with the "Delegated User Management" tool for membership of each group you need for your work.
- EMEA and US region: https://cdls-eu.bmwgroup.net/dum/
- CHINA region: https://cdls-cn.bmwgroup.net/dum/
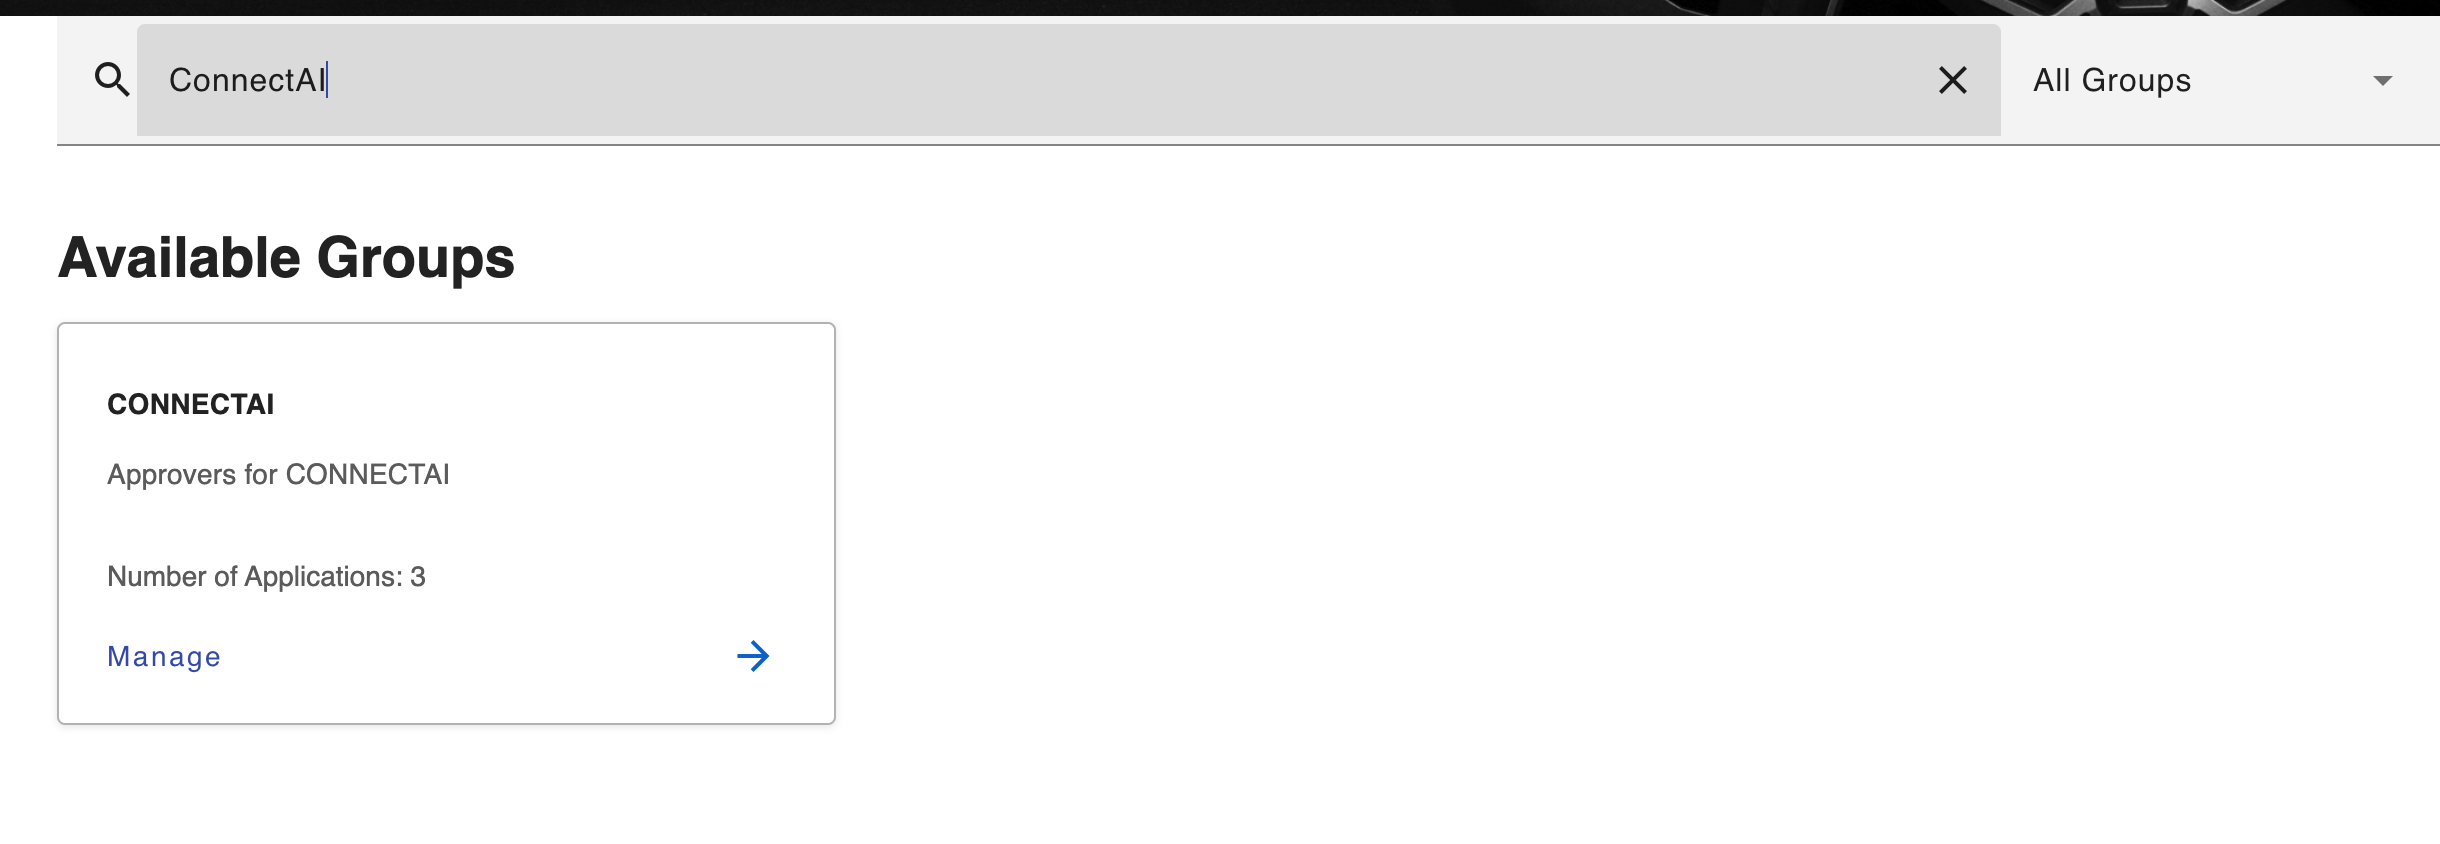
Select Group "ConnectAI" as below
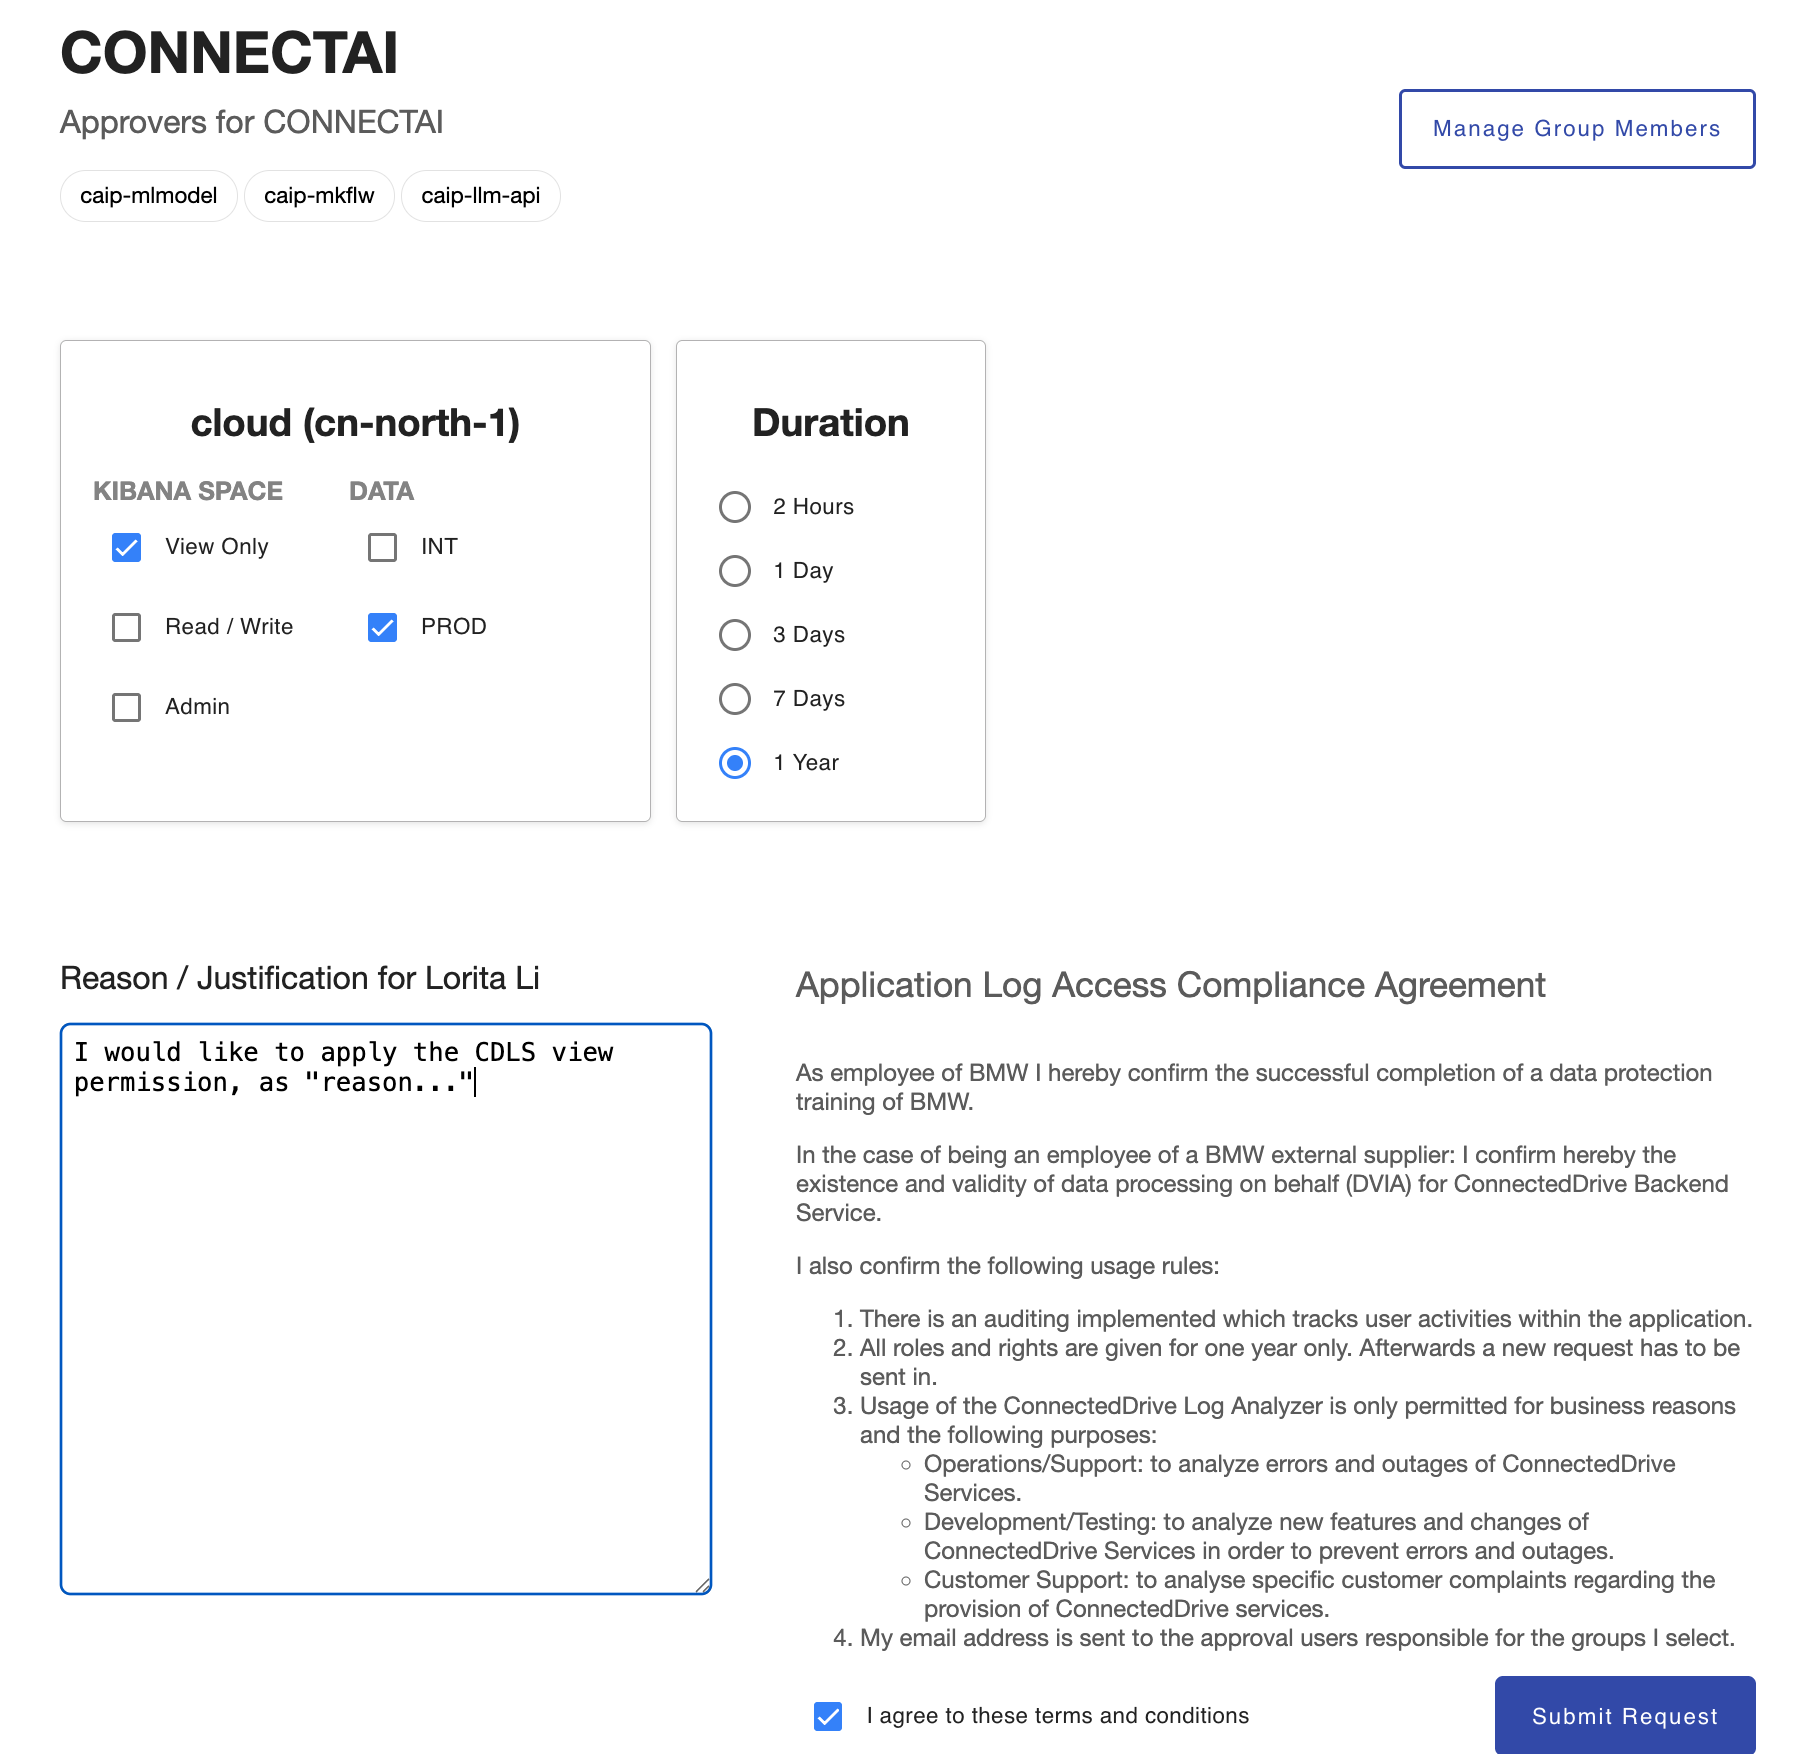
Select permissions you need and submit your request The requests are devided into Kibana space permissions and permissions for accessing the log data. Kibana space permissions decide how much of the Kibana functionality is available to the user.
- The View Only permission gives access to all log data and allows to create and save searches, and create reports.
- The Read / Write permission gives access to all log data and allows to create and save searches, visualizations and dashboards, and create reports.
- The Admin permission contains all rights of Read / Write and additionally gives access to Data View Management, Saved Objects Management and Advanced Settings. It should only be requested by advanced Kibana users and used with care.
Give a reason for your request and agree with the compliance regulations, waiting for approval.
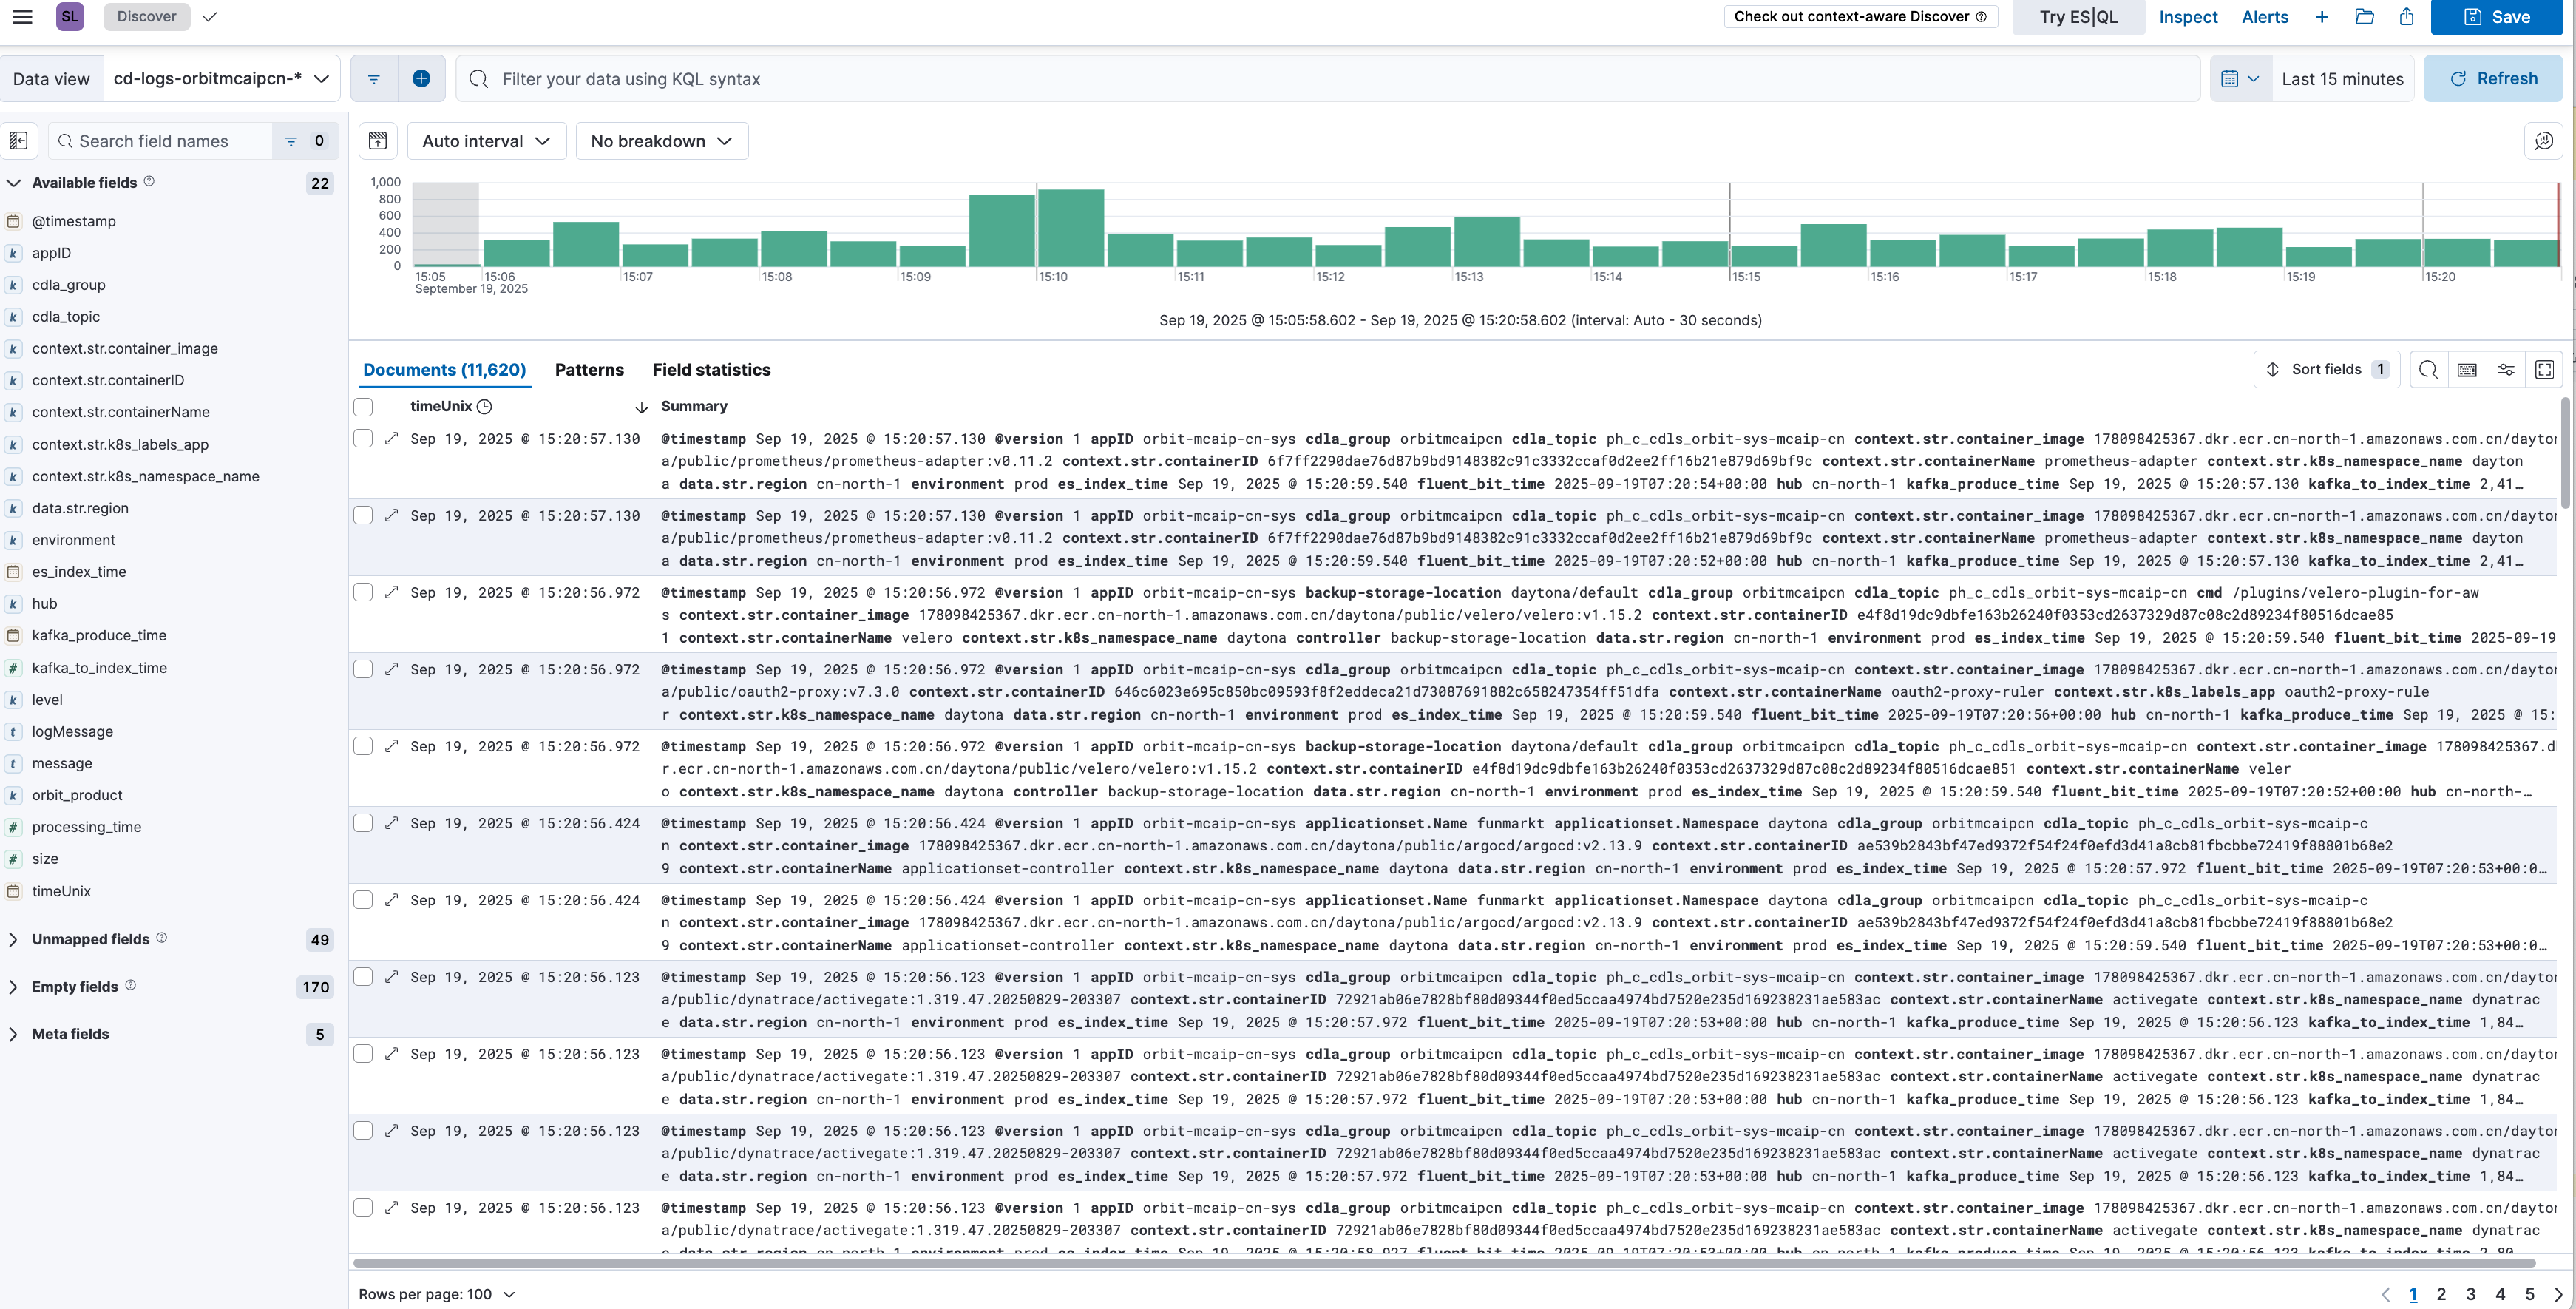
After approved, you will get a e-mail notification, and now you are able to access to Connected AI Platform CDLS, Access link:
Grafana
Grafana is a powerful open-source platform designed for visualizing and analyzing data in real-time. It allows users to create dynamic, customizable dashboards that display metrics and analytics from various sources in a visually appealing way.
With support for a wide range of data sources, including databases, and monitoring tools, Grafana simplifies the process of monitoring and understanding complex data sets, enabling users to make informed decisions quickly and efficiently. See the official Grafana docs.
Prerequisites
Please make sure to enable Grafana via Pull-Request based self-services, see example PR here.
Best Practices
You can refer to the Grafana official documentation on Best Practices tips and instructions:
- Handbook
- Best practices: build-dashboards/best-practices-to-follow
- Data Sources: grafana-data-sources
- Caching: data-source-management/query-and-resource-caching
Standard Resources
The Connected AI Platform is making available by default the resources as below:
Requests:
- CPU: 500m
- Memory: 500MB
Limits:
- CPU: 2
- Memory: 8GB
Advanced Features
Grafana Plugins
Grafana plugins expand the platform's functionality, offering a range of custom visualizations, data source integrations, and panels. They empower users to tailor dashboards, accessing diverse data sources and presenting insights through specialized charts, maps, and widgets. These plugins enhance Grafana's versatility, enabling tailored solutions for specific monitoring, analytics, and visualization needs.
Plugin Types
These plugins can be categorized into the following types:
-
Data Source Plugins: Allow connection to different data repositories like databases, cloud services, or custom APIs, enabling users to fetch and visualize data from various sources.
-
Panel Plugins: Offer diverse visualization options such as charts, graphs, maps, and other widgets to represent data in customized formats within Grafana dashboards.
-
App Plugins: Extend Grafana's functionalities beyond visualization, providing additional features like alerting, data transformation, or administration tools.
-
Backend Plugins: Focus on enhancing the core functionalities of Grafana, offering modifications or extensions to the backend infrastructure.
Supported Data Sources
The Connected AI Platform actively maintains the following data source plugins:
AWS Athena as Data Source
We can add AWS Athena as a data source for Grafana to visualize data. The following guide explains how to create AWS Athena as a data source.
Necessary Permissions
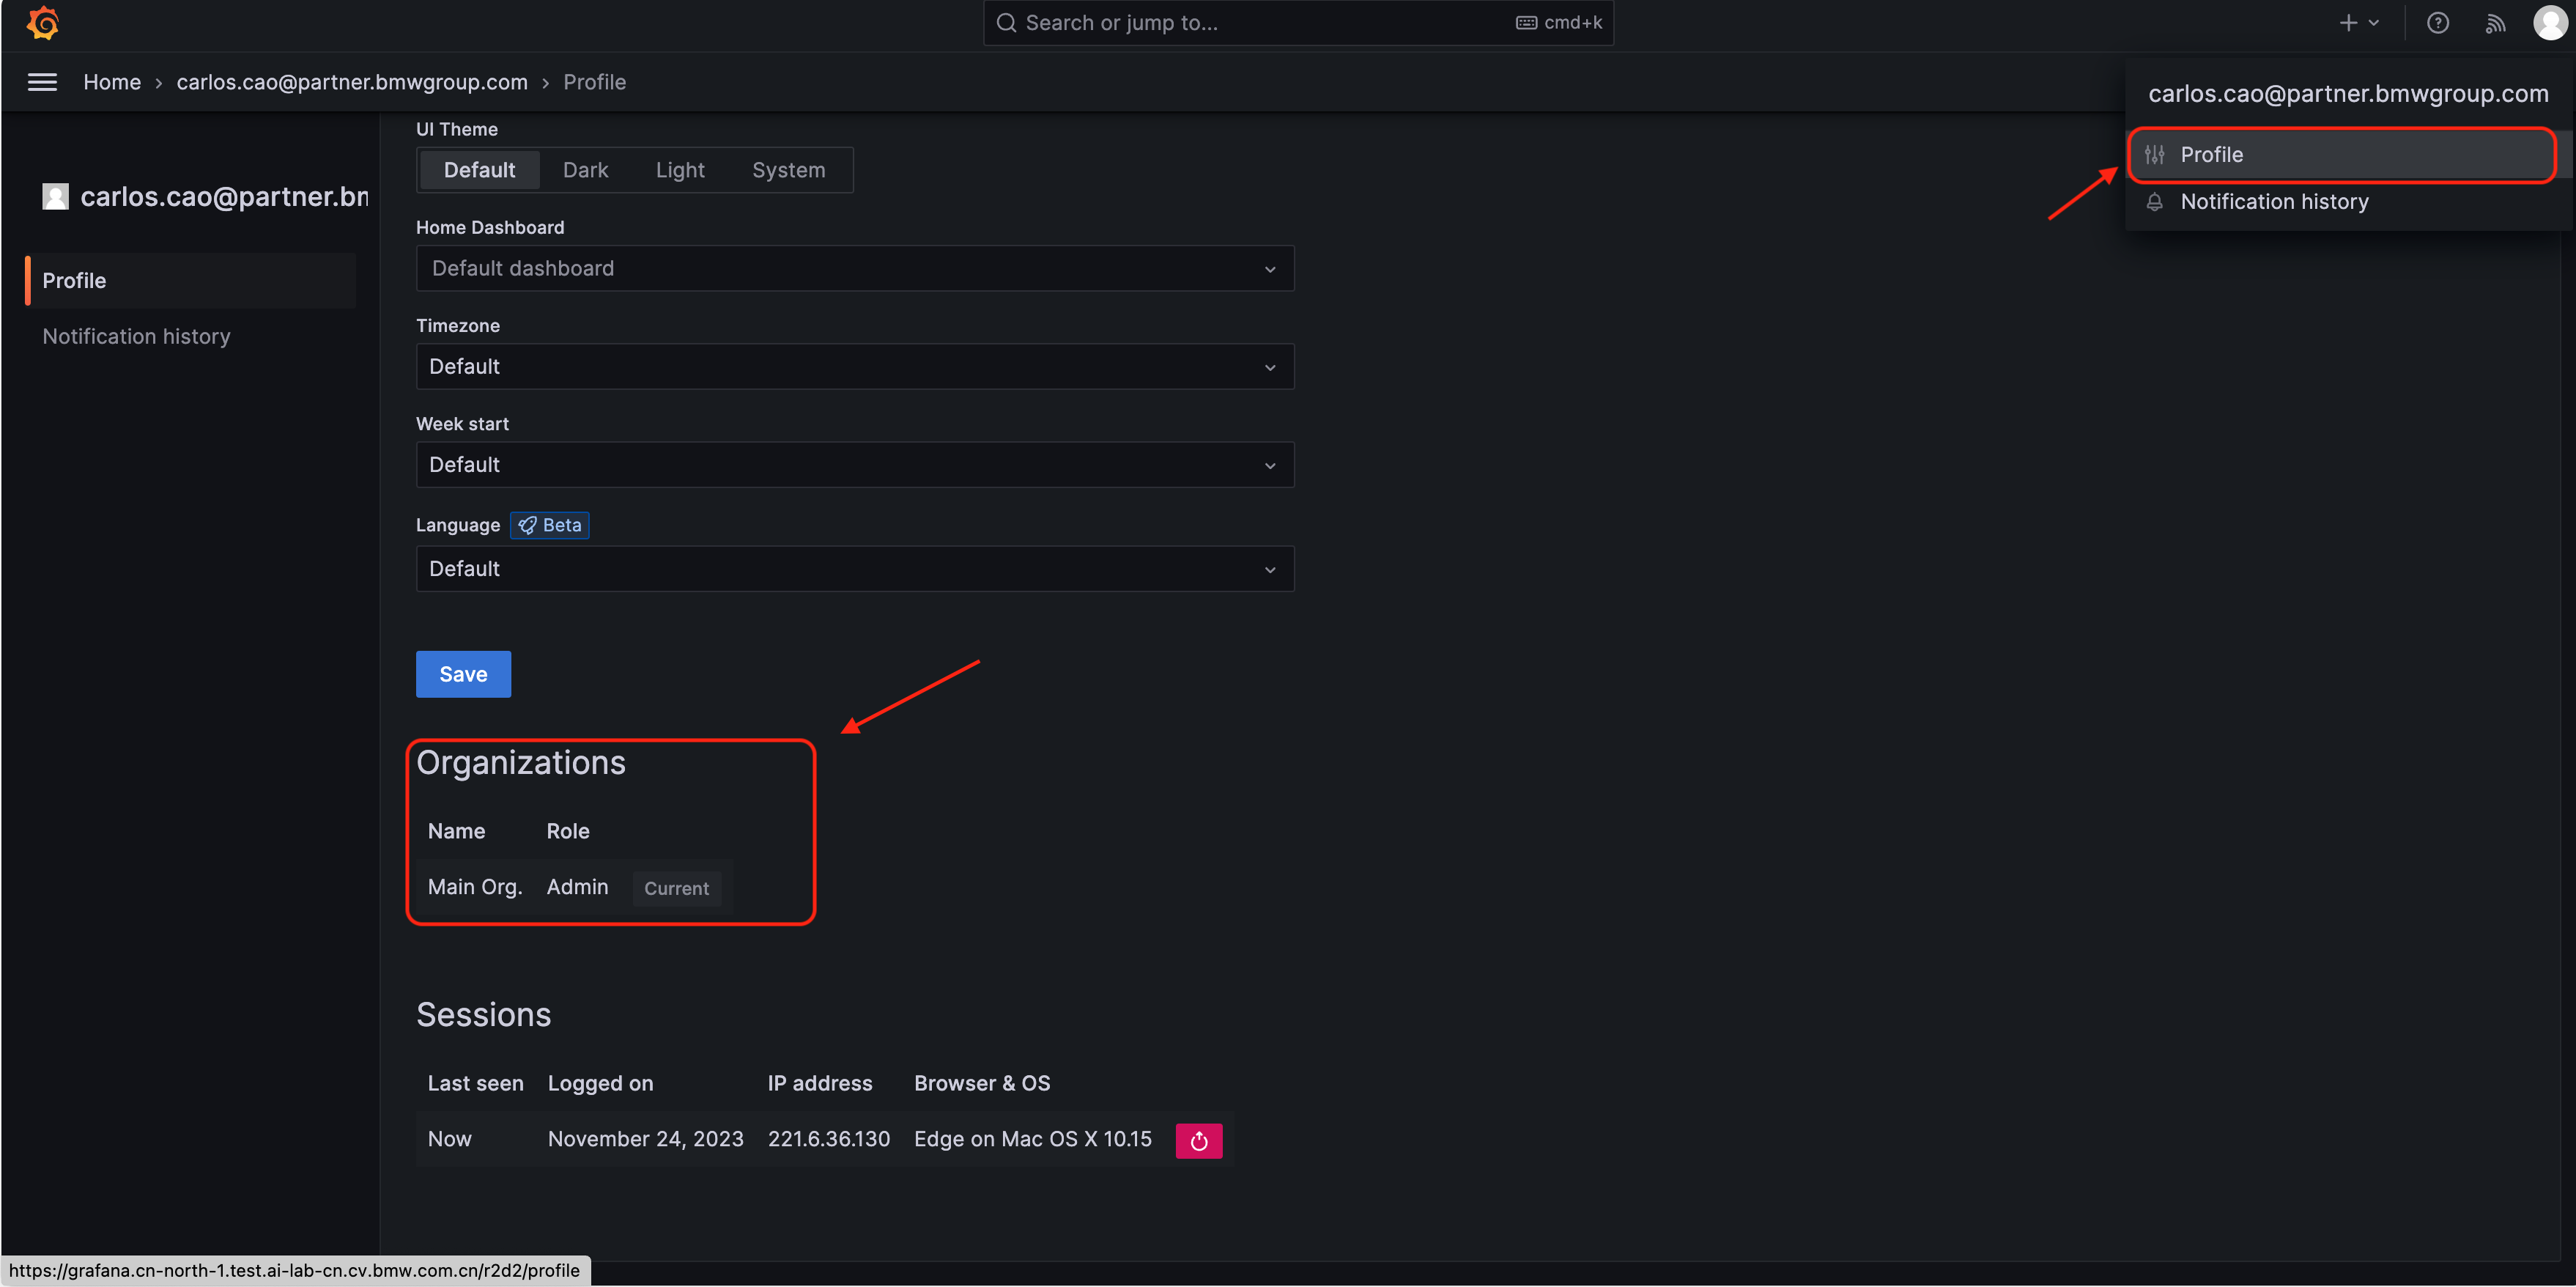
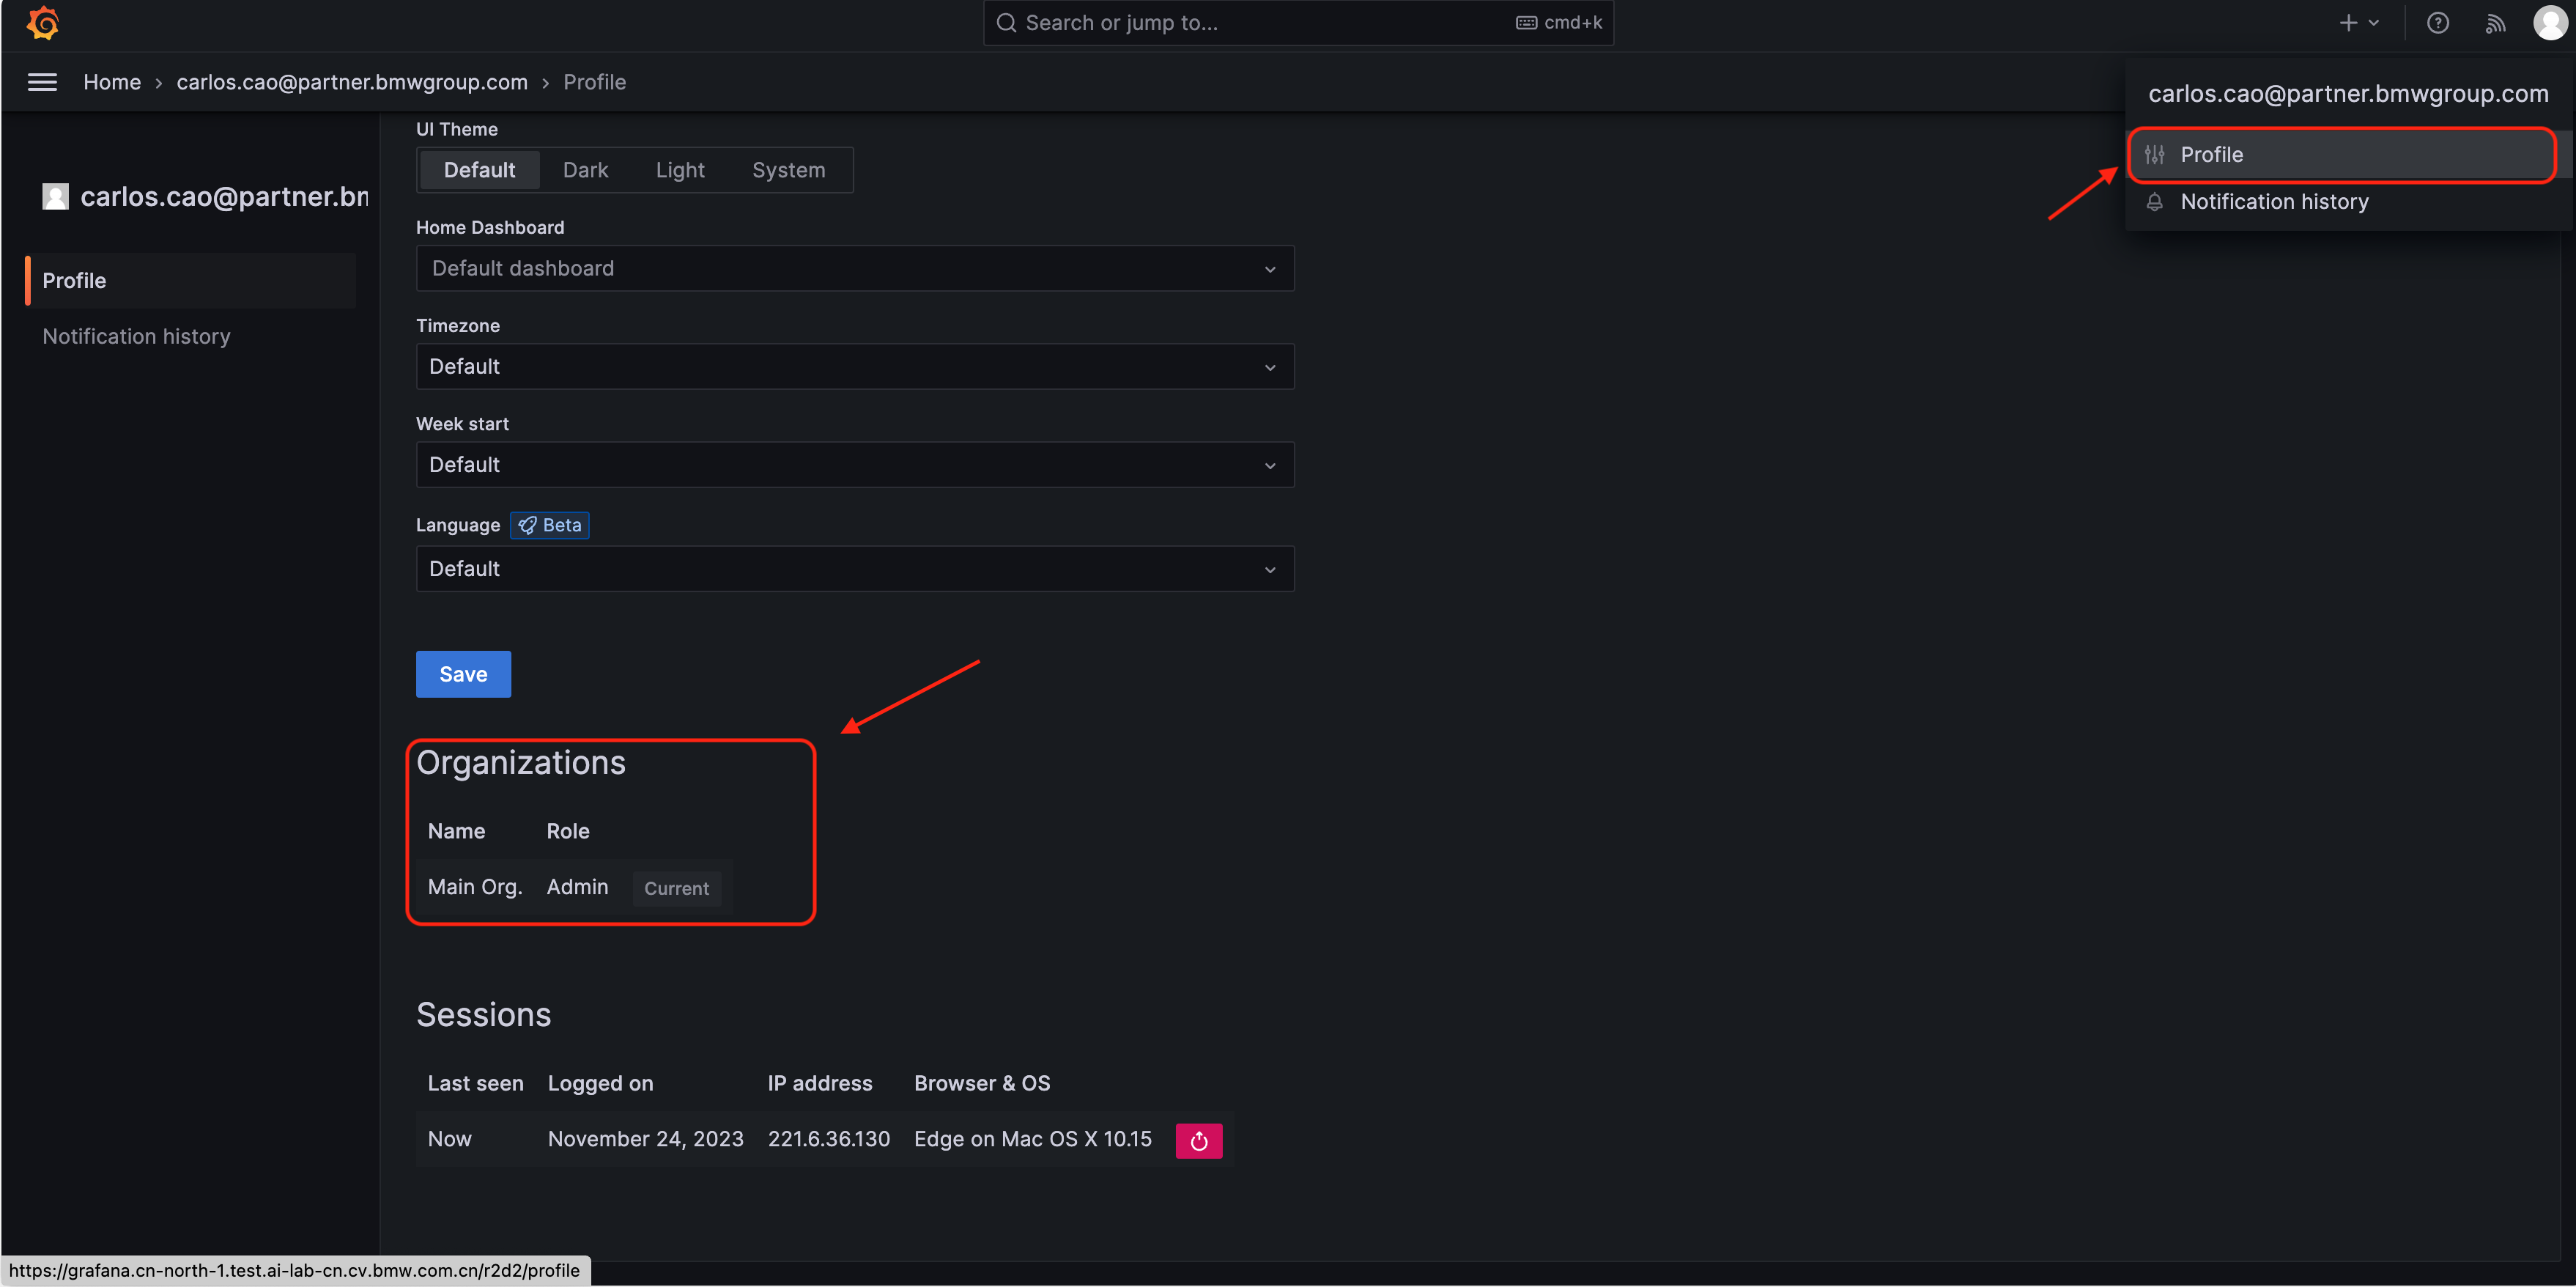
Grafana has three user roles: Admin, Editor, and Viewer. You can refer to this link for details. Only the Admin role has permission to manage data sources. Therefore, before adding a database, ensure that your role is Admin.
Create New Data Source
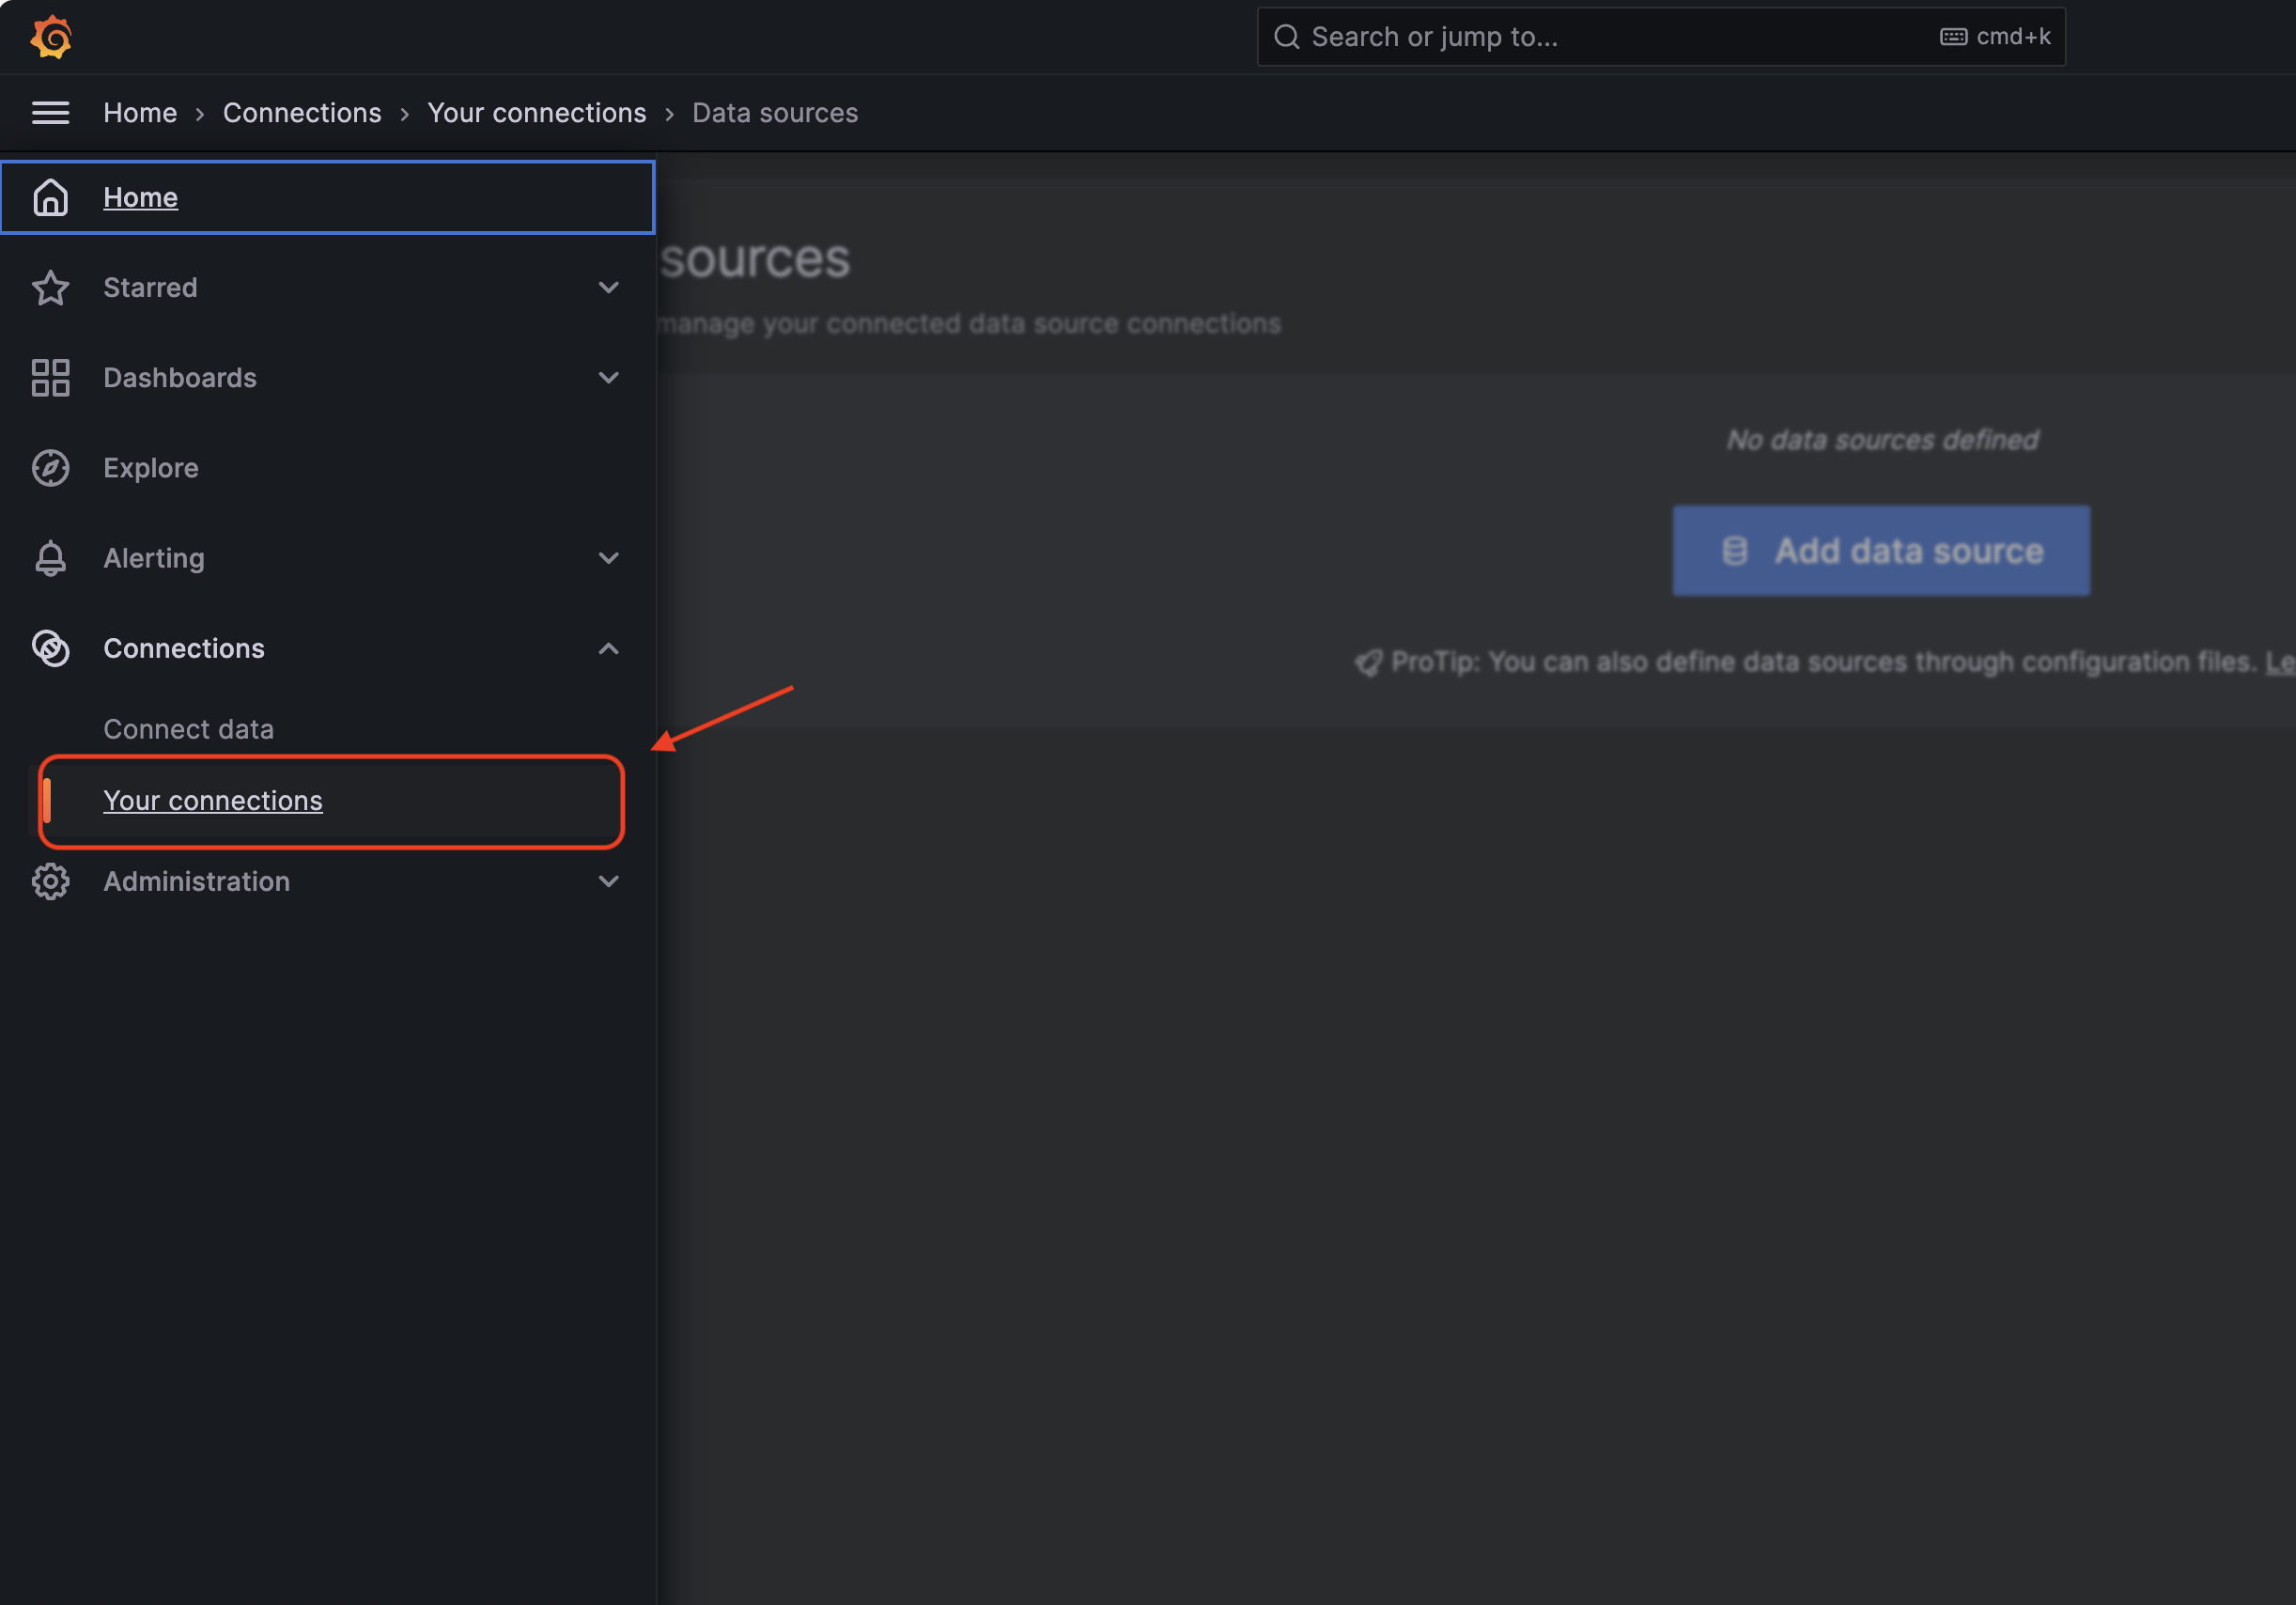
Access the submenu "Your connections" in "Home" menu, and click "Add data source".
Choose "Amazon Athena" as the data source.
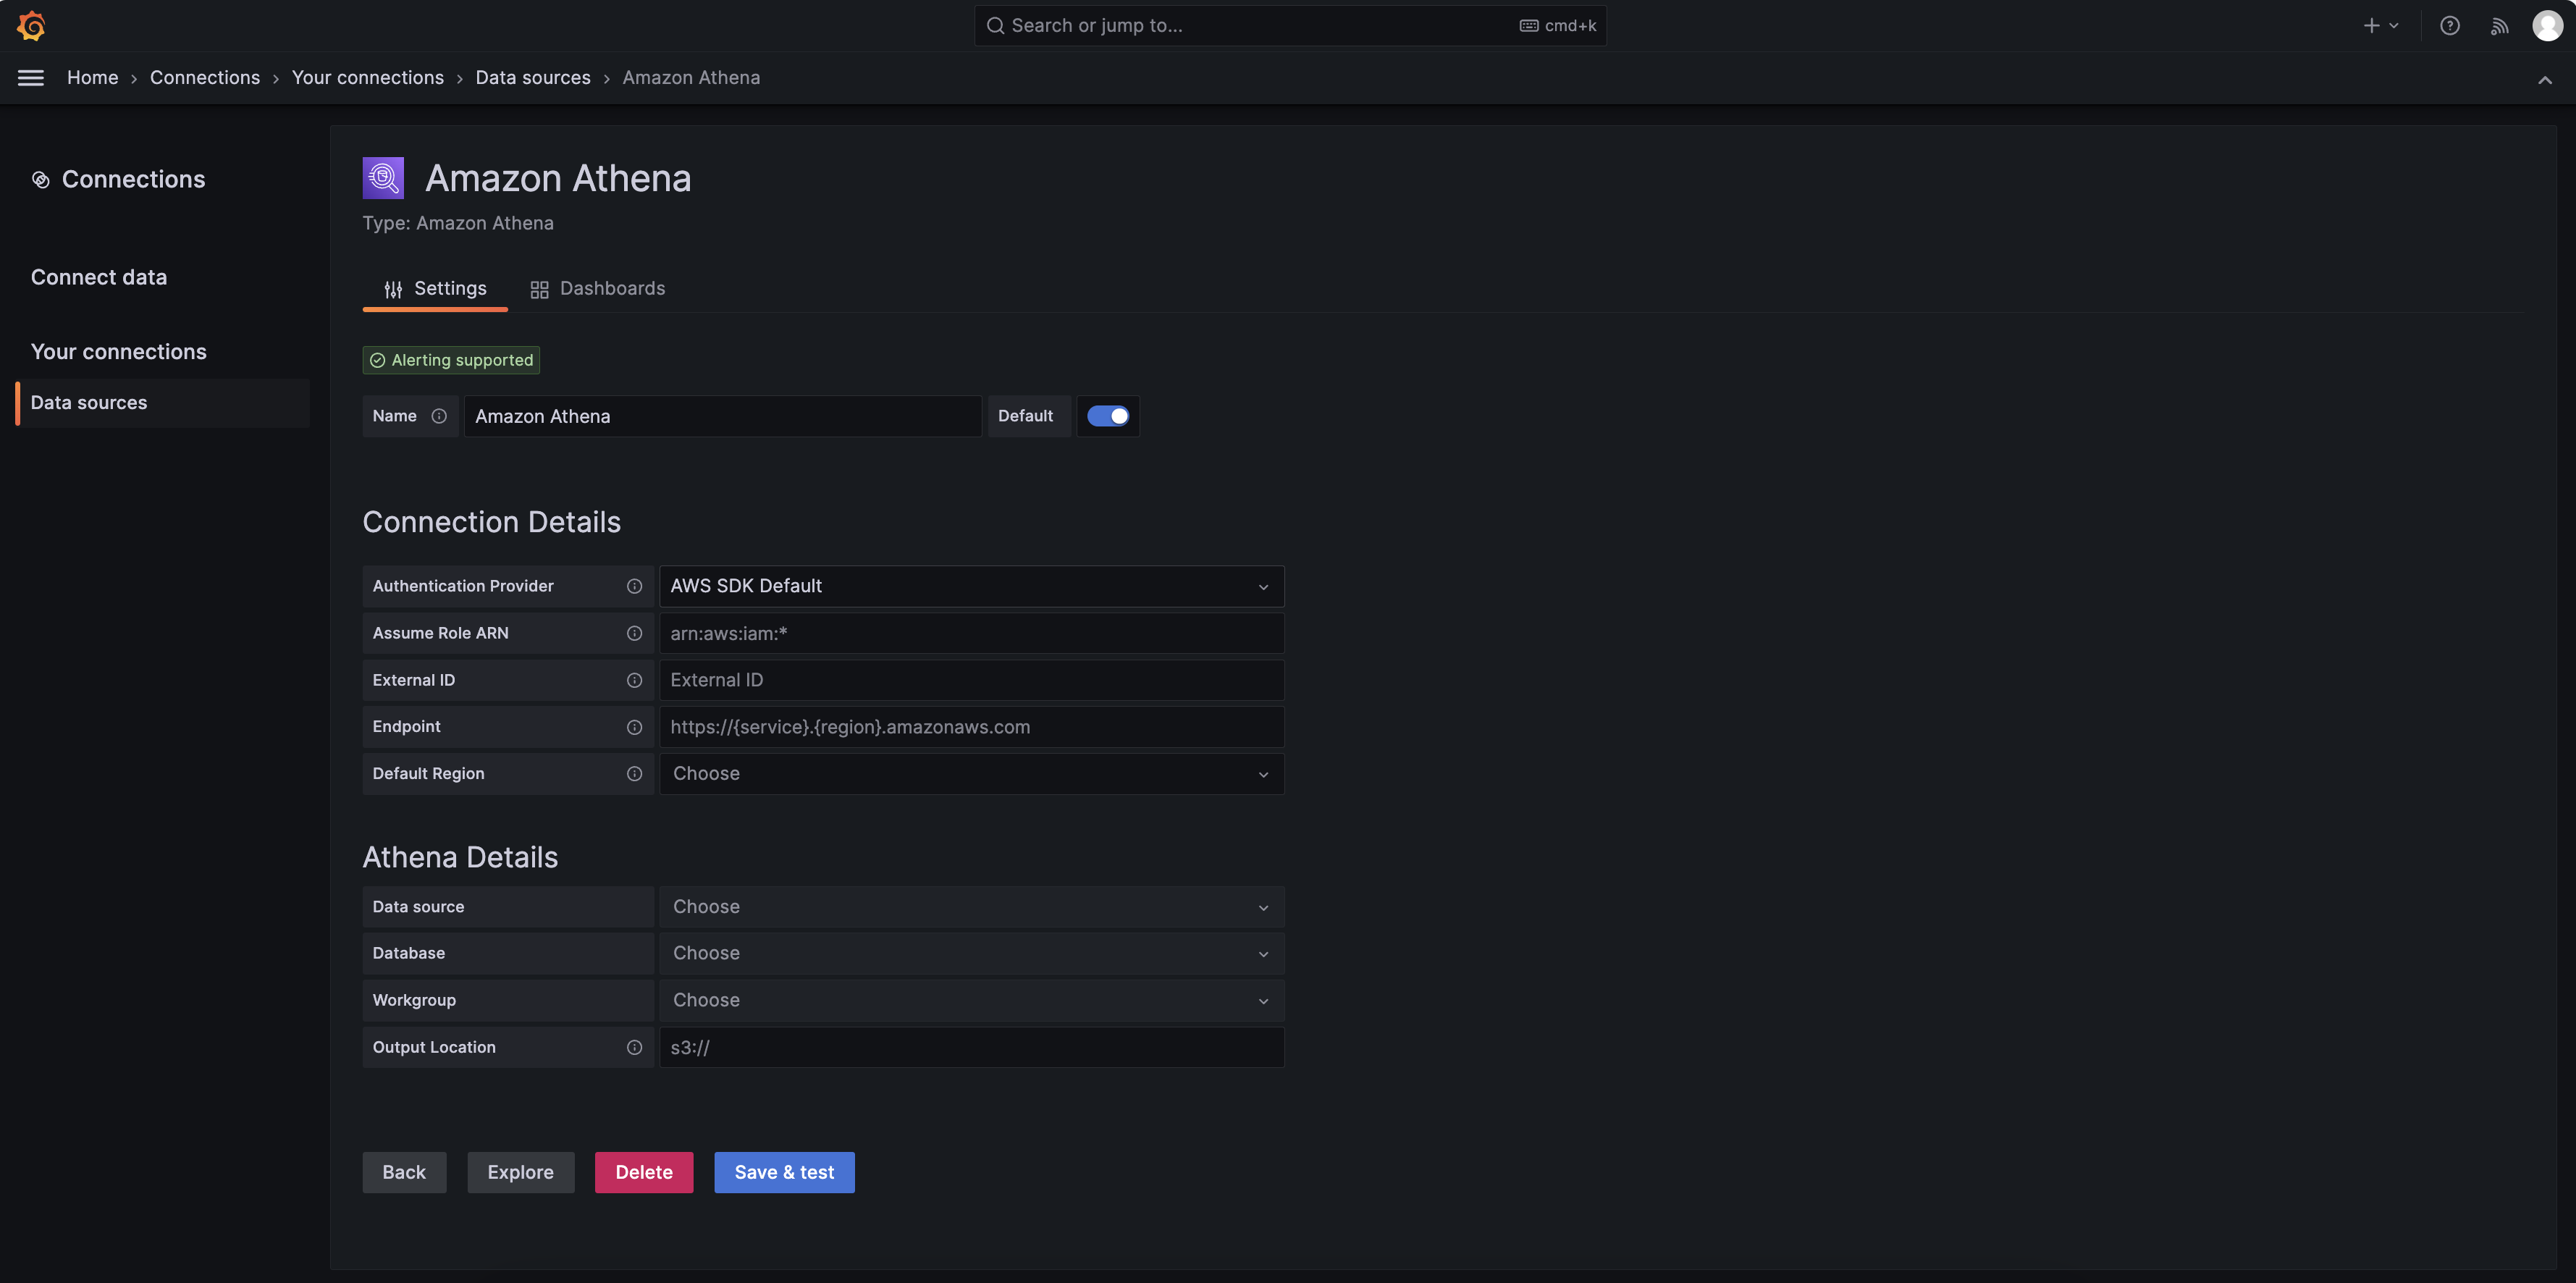
Configure Your Connection
By default, our Grafana runs with data-visualization role and already has permission to access your product's AWS Athena, Glue, and some S3 buckets (<aws_partition>:s3:::cd4ml-<product>-*-<namespace> and <aws_partition>:s3:::cd4ml-<product>-*-<namespace>/athena_workgroup_output/*).
Here is an example connection:
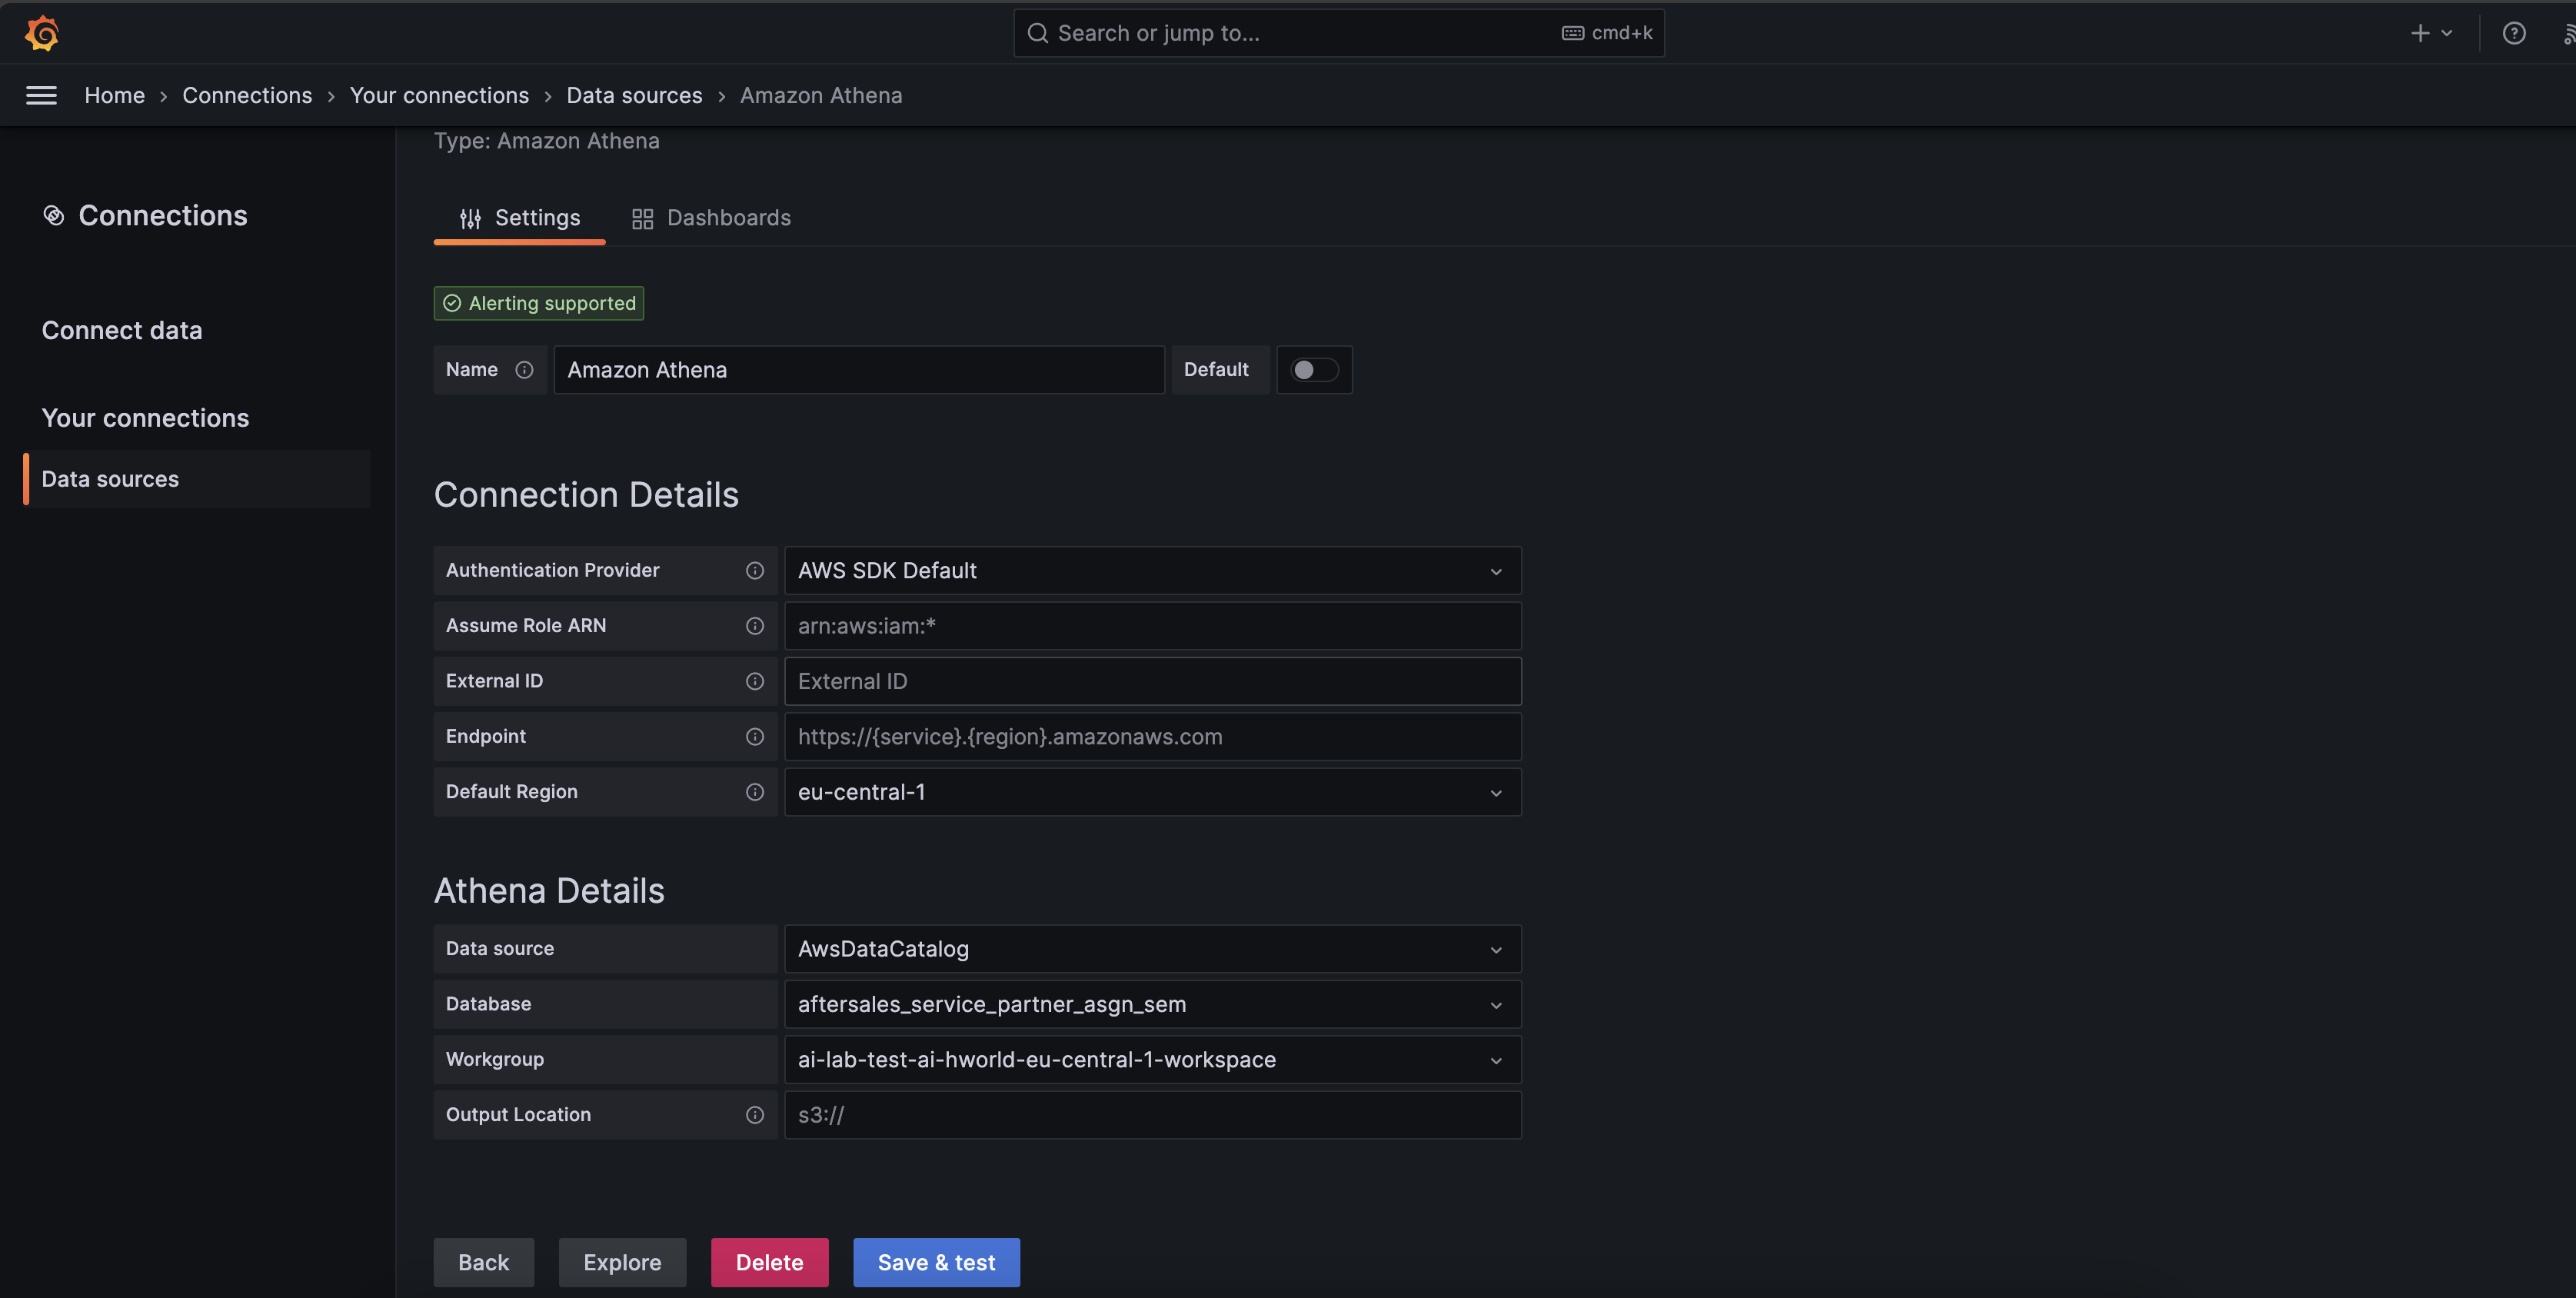
Configuration Parameters:
- Authentication Provider: You can select "AWS SDK Default", "Access & secret key" or "Credentials file". In this guide we keep the default value.
- Assume Role ARN: This is optional. If you keep it blank, the default role ARN is
arn:<aws_partition>:iam::<aws_account_id>:role/<product_name>-<region>-<env>-<namespace>-data-visualization - External ID: Keep blank if you don't have any special requirements.
- Endpoint: Keep blank if you don't have any special requirements.
- Default Region: The region for your product.
- Data source, Database, Workgroup, Output Location: These values are retrieved from AWS Athena and AWS Glue. Simply choose the ones you want.
For more detailed information regarding the connection setup, refer to: Grafana Athena Datasource
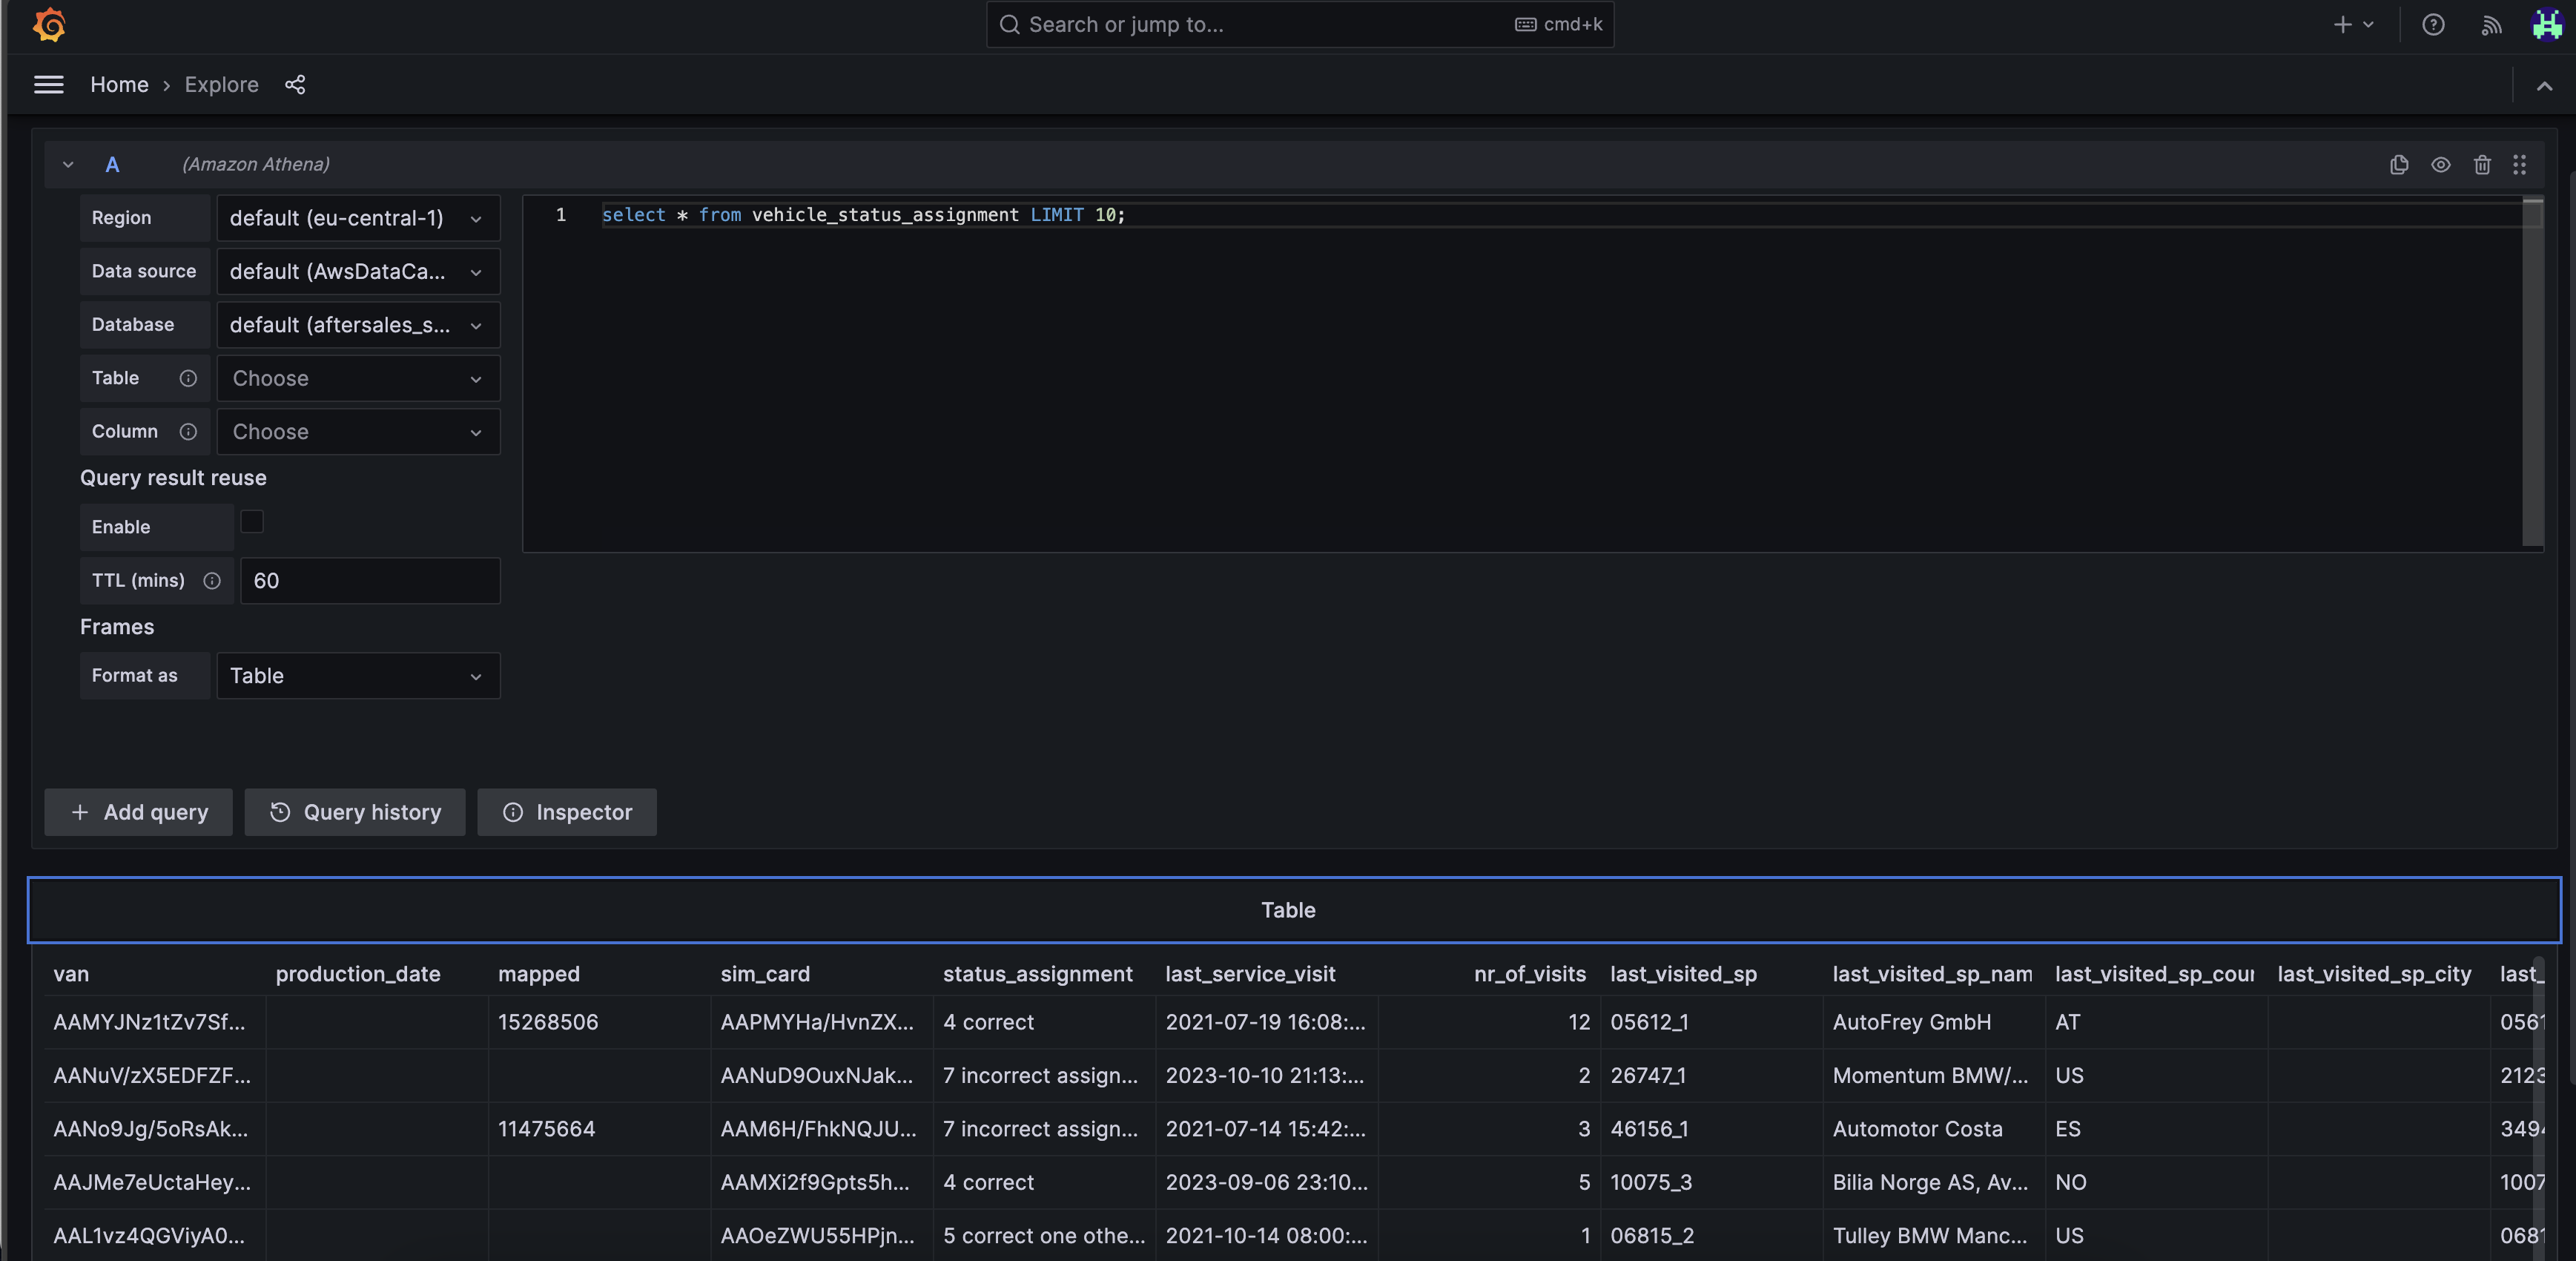
Test Your Amazon Athena Data Source
Input a test query command and you will get the result. For example, in this guide, the command is:
select * from vehicle_status_assignment LIMIT 10;
Key Features:
- Direct SQL queries on S3 data
- Cost-effective analytics on large datasets
- Seamless integration with existing AWS infrastructure
- Support for various data formats (Parquet, JSON, CSV, etc.)
Create a Dashboard for Athena Data Source
To create a simple Grafana dashboard using Athena metrics, follow the steps below. In this example we are using AwsDataCatalog as data source catalog, aftersales_service_partner_asgn_sem as database, and vehicle_status_assignment as table.
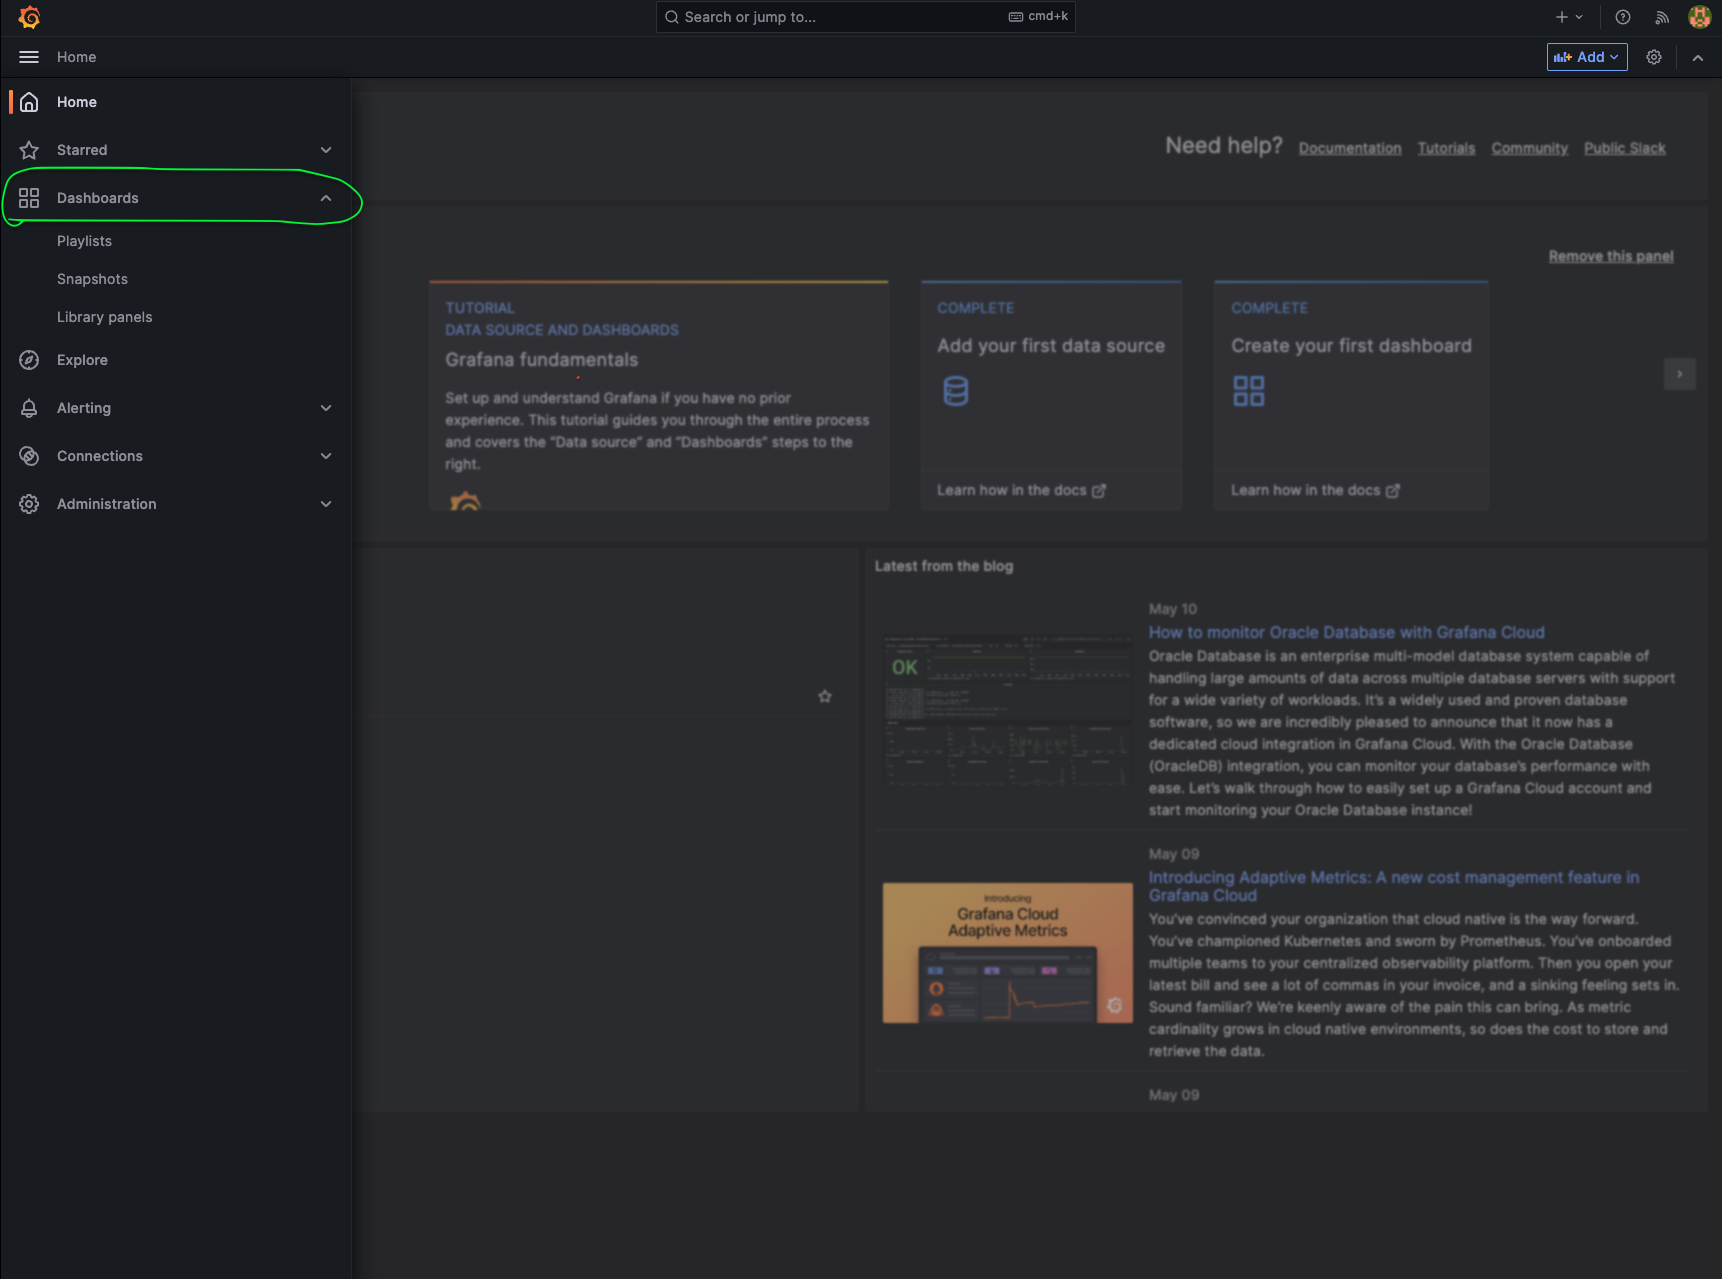
From the Grafana home page, click on the top left corner button, select Dashboards, then click New → New Dashboard → Add Visualization
On the next page, in the Query tab at the bottom, make sure your Data source is Amazon Athena. In this tab you can set the default datasource, database, and table of your choice. This information can be used as default values for Grafana macros, which are dynamic values and functions that simplify query syntax.
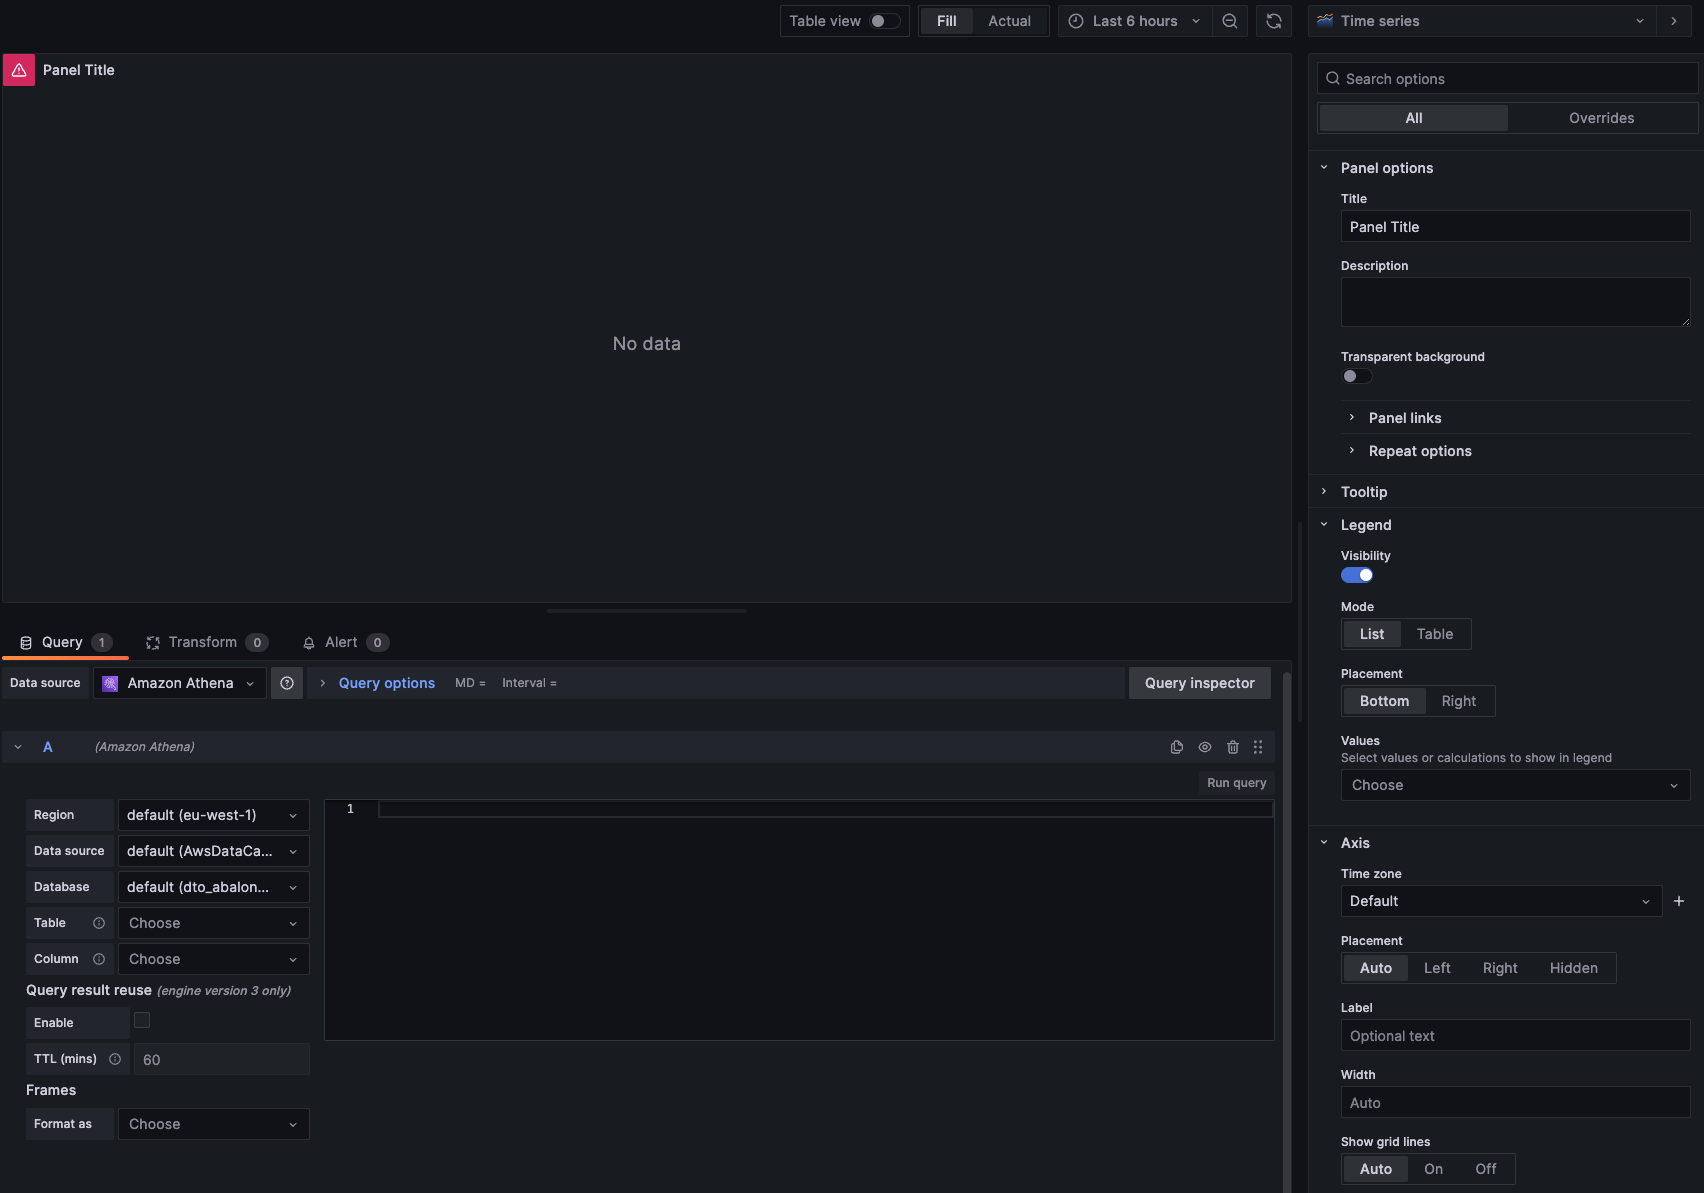
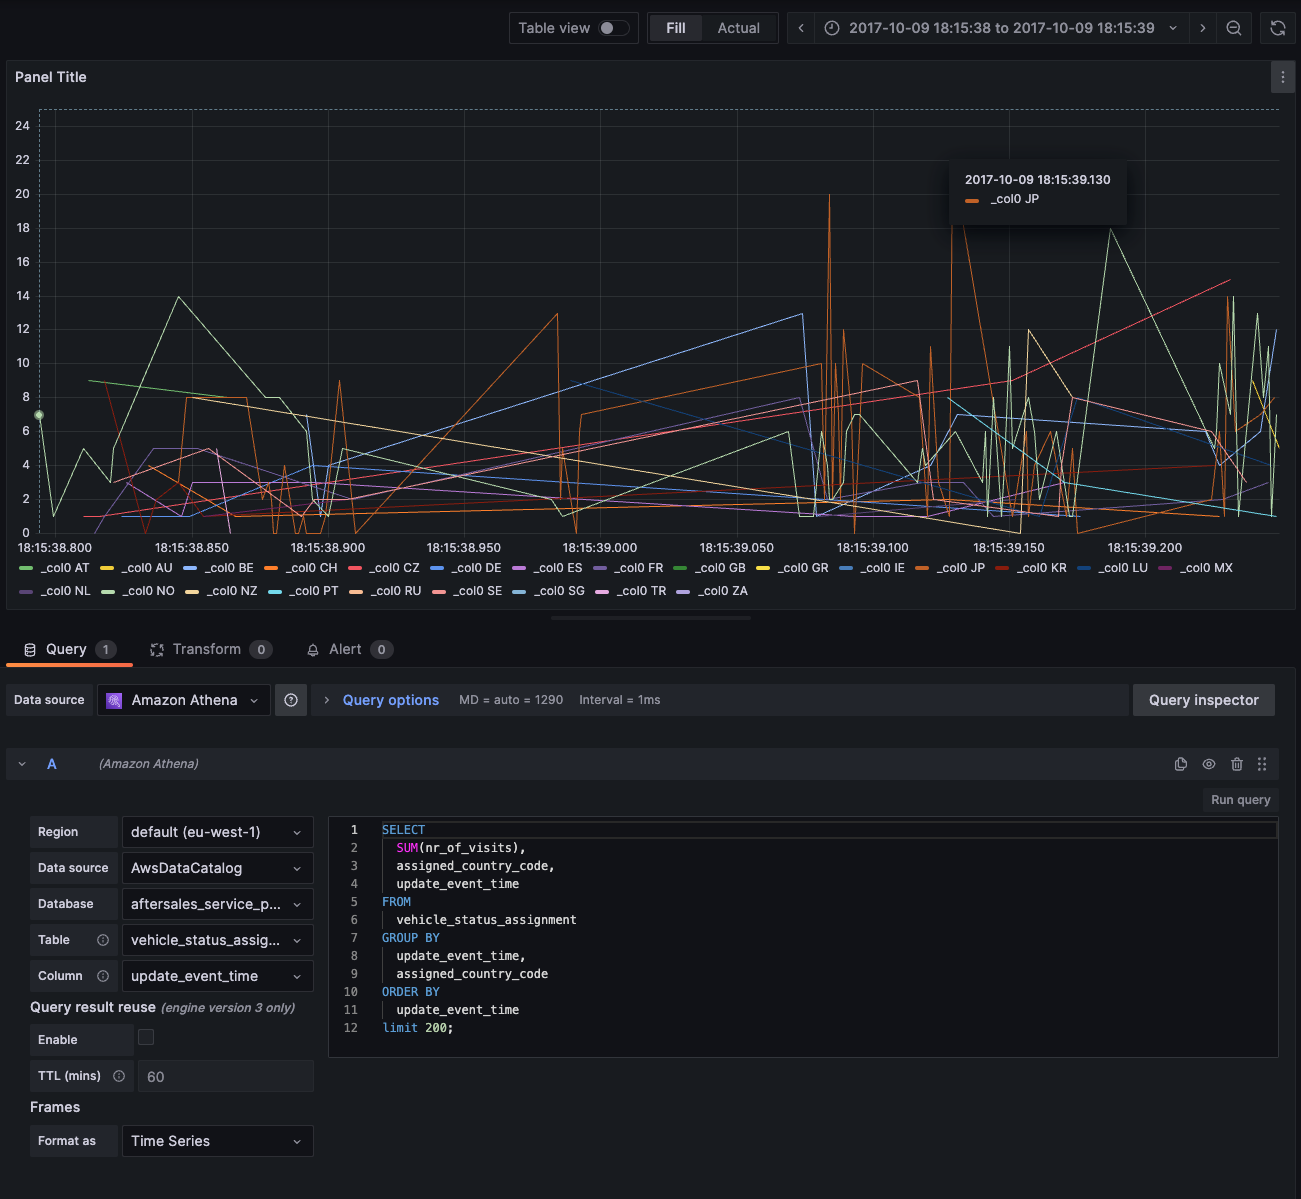
Then you can write the SQL query to Athena and fetch the data in the format you want to display, applying column transformations, grouping by date fields for time series, and many other operations. In the example below, the query is:
SELECT
   SUM(nr_of_visits),
   assigned_country_code,
   update_event_time
FROM
   vehicle_status_assignment
GROUP BY
   update_event_time,
   assigned_country_code
ORDER BY
   update_event_time
limit 200;
The dashboard JSON file is included below. If you import it through the /dashboard/import page, it will look like this screenshot:
Key Features:
- Build interactive dashboards with real-time data from S3
- Create custom visualizations for business intelligence
- Set up automated refresh intervals for up-to-date insights
- Combine Athena data with other data sources for comprehensive views
S3 or Other Datasources
Normally, most of the artifacts generated by Kubeflow pipelines or some other datasets are stored as S3 objects when using AWS. These objects normally contain business data that can be processed to enable the ability of creating dashboards on data visualization tools like Grafana or Quicksight. Athena supports creating a database, which is the name used for a set of tables containing data stored on S3 locations, directly from the UI as described on AWS Athena Getting Started, it's useful when we want to make quick tests by running queries on some datasets.
In most of our use cases, we have multiple Parquet or JSON files with a common schema stored in a specific S3 bucket prefix.
These files can be processed by AWS Glue Crawlers, which identify the schema pattern across files under an S3 path using classifiers and create a single metadata table in the AWS Glue Data Catalog. Please see our example pipeline here to learn how to create and run a Glue Crawler from within a Kubeflow pipeline, including detailed information about the necessary naming convention and role.
Once tables are added to the catalog, since Athena has built-in support for viewing tables in the Glue Data Catalog, we can query these tables using Athena. The integration of S3, Glue, Athena, and Grafana provides a comprehensive data visualization pipeline.
Key Features:
- Direct access to raw data files
- Support for multiple file formats (Parquet, JSON, CSV)
- Scalable data visualization capabilities
- Cost-effective storage and querying solutions
- Integration with AWS Glue Data Catalog
- Automated schema detection via Glue Crawlers
AWS RDS as Data Source
We can add RDS as a data source for Grafana to visualize data. The following guide explains how to create RDS as a data source.
Necessary Permissions
Grafana has three user roles: Admin, Editor, and Viewer. You can refer to this link for details. Only Admin role have the permission to manage data sources. Therefore, before adding a database, ensure that your role is Admin.
Create New Data Source
Access the submenu "Your connections" in "Home" menu, and click "Add data source".
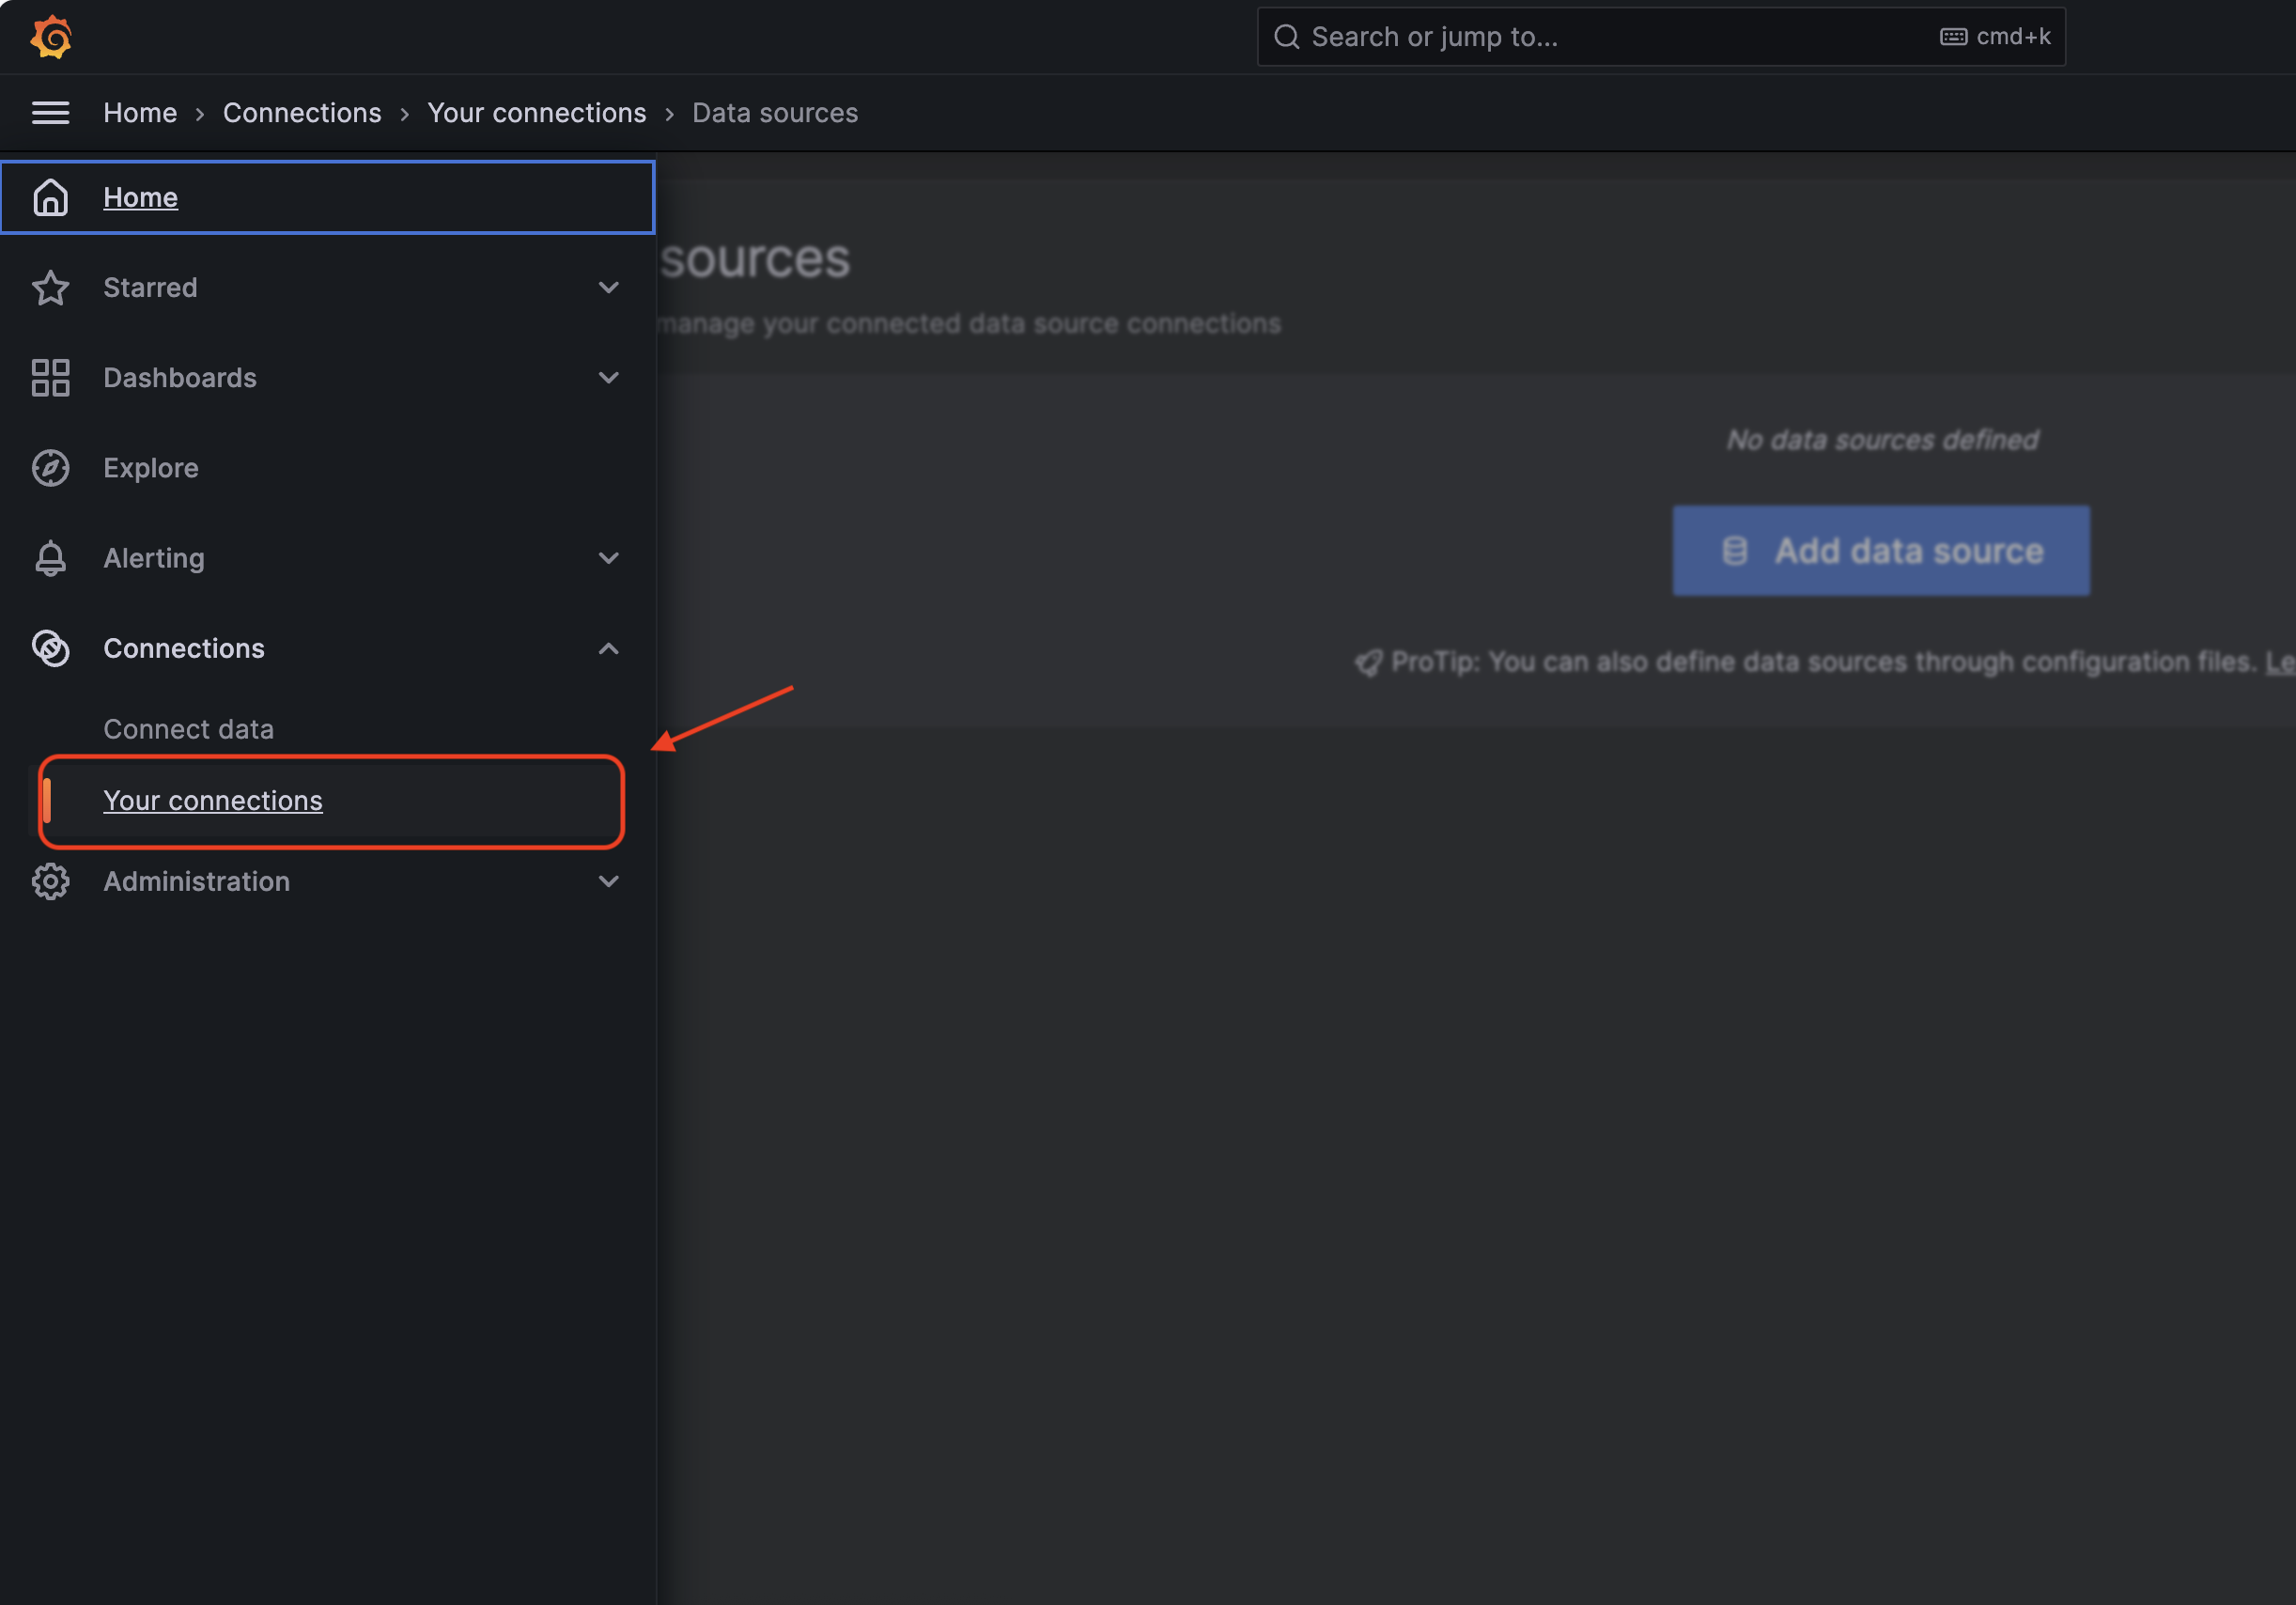
Choose "MySQL" as the data source.
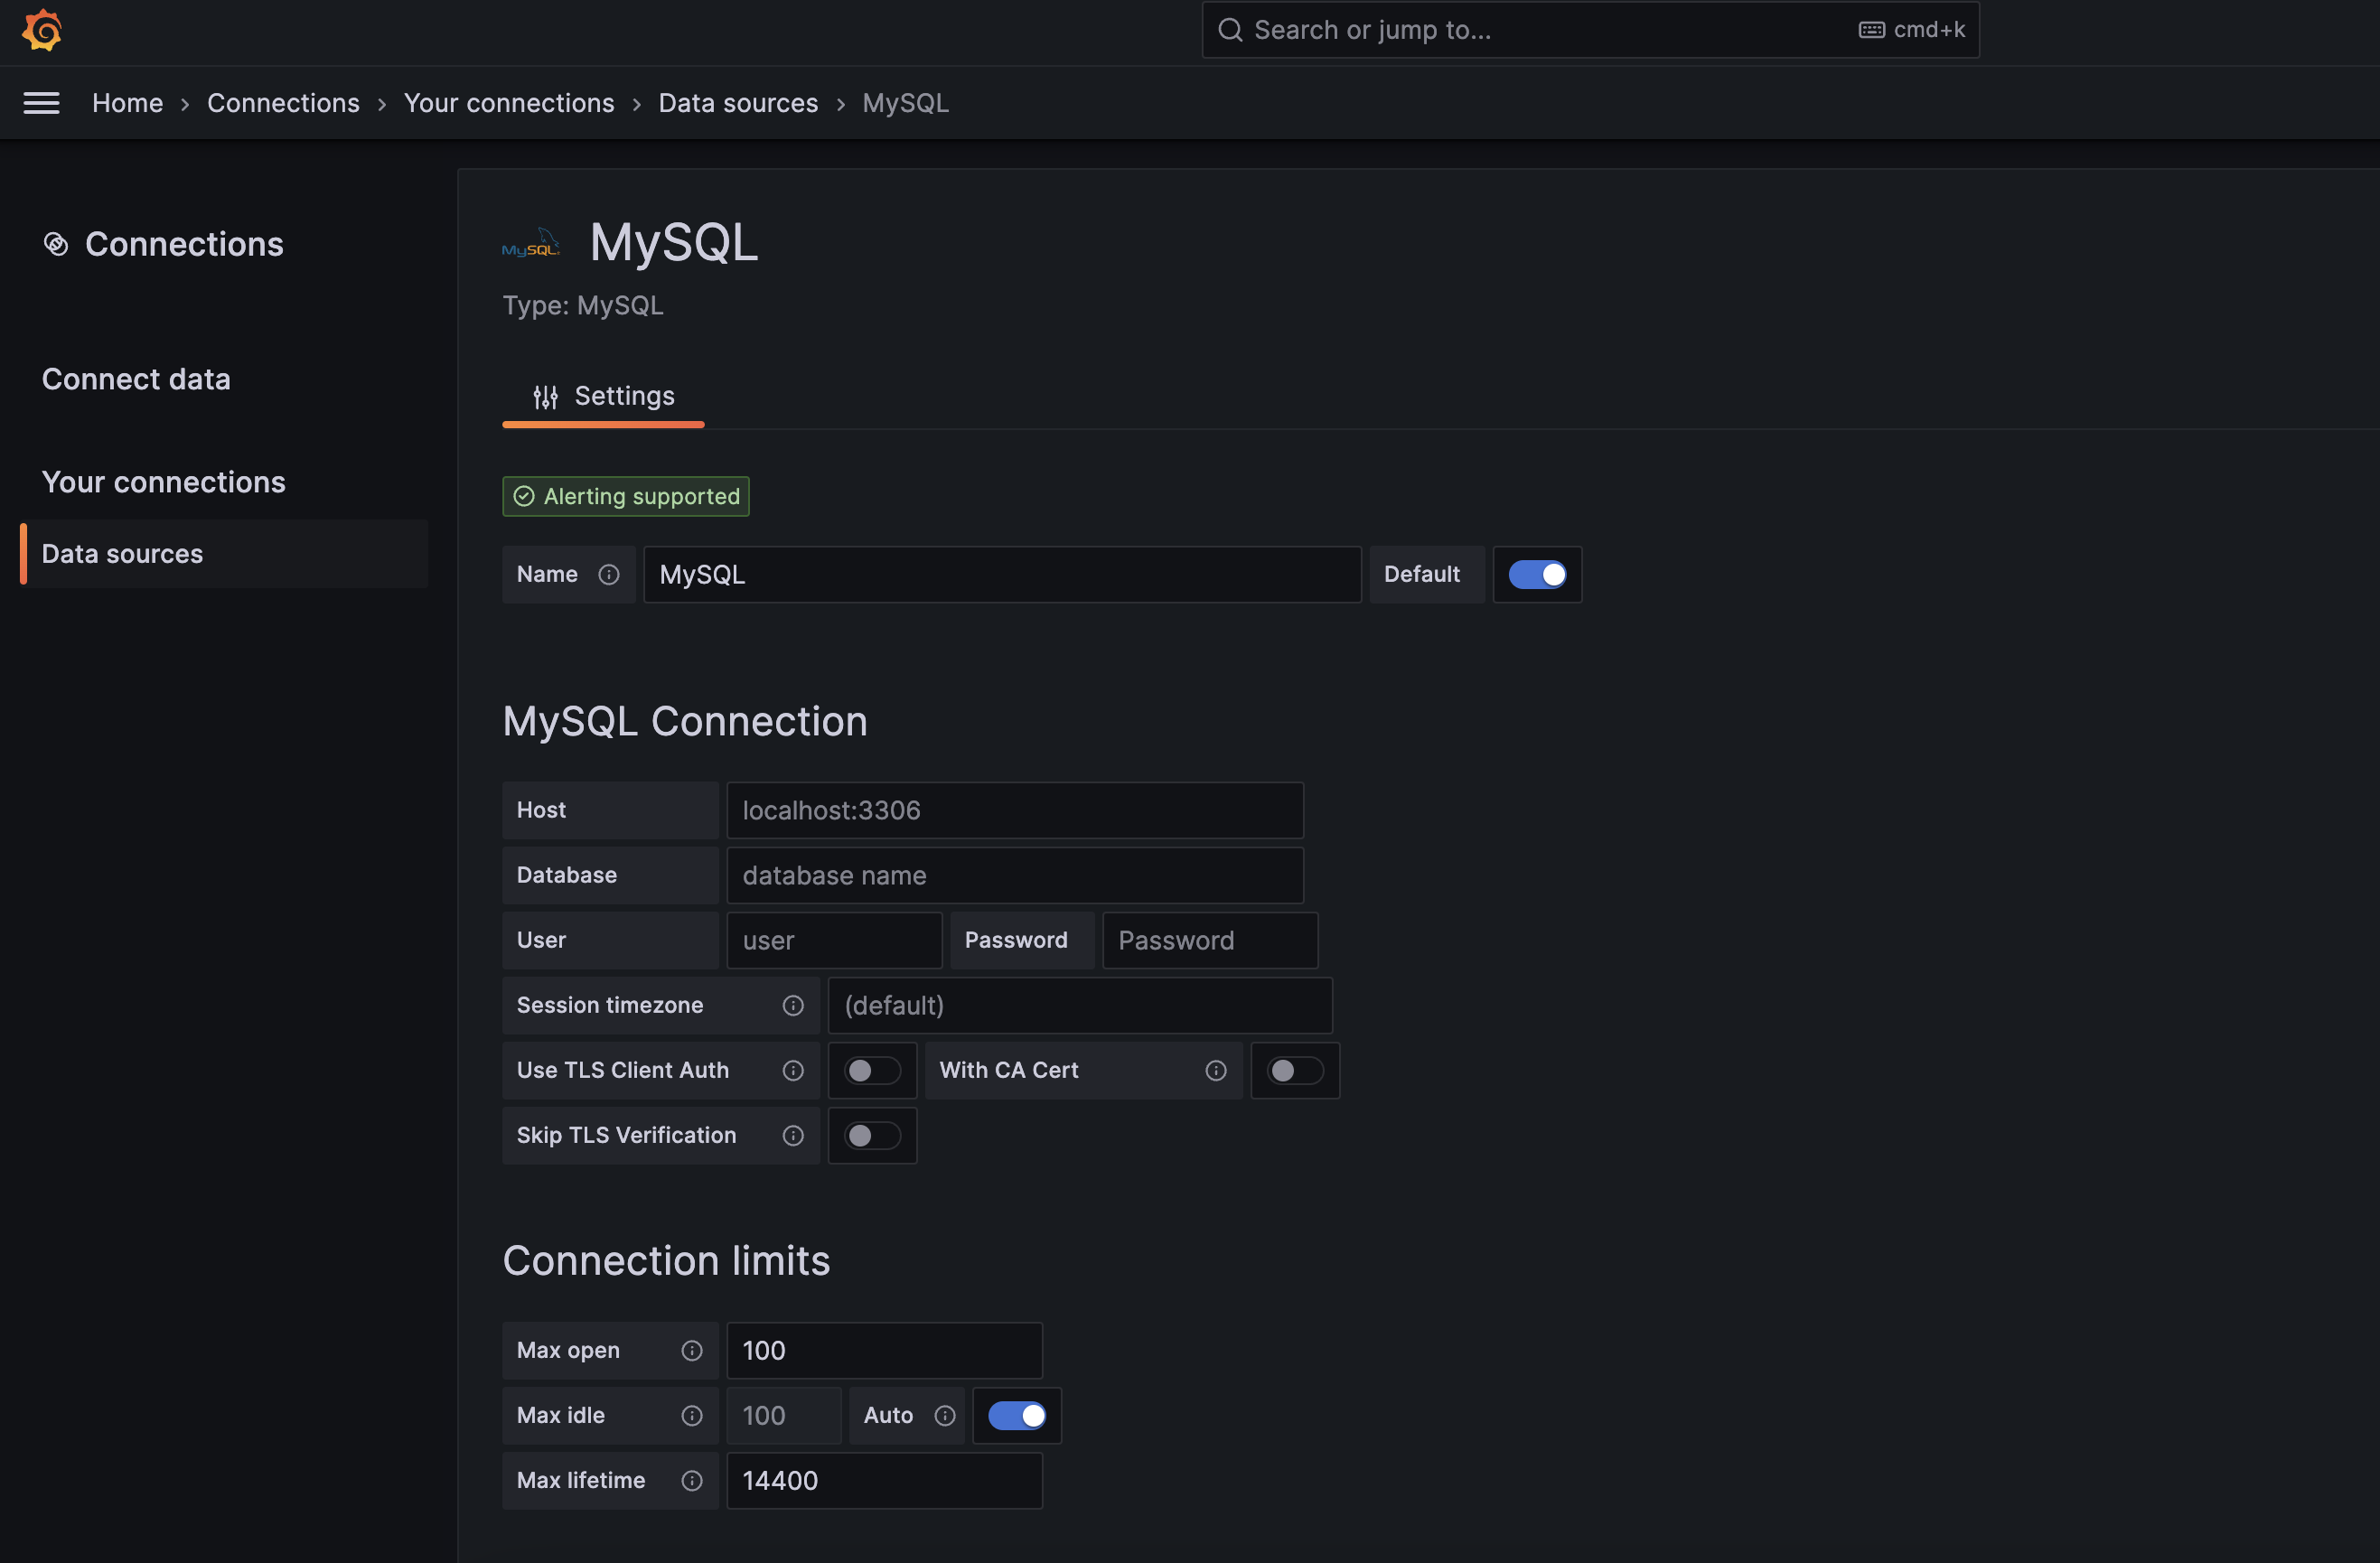
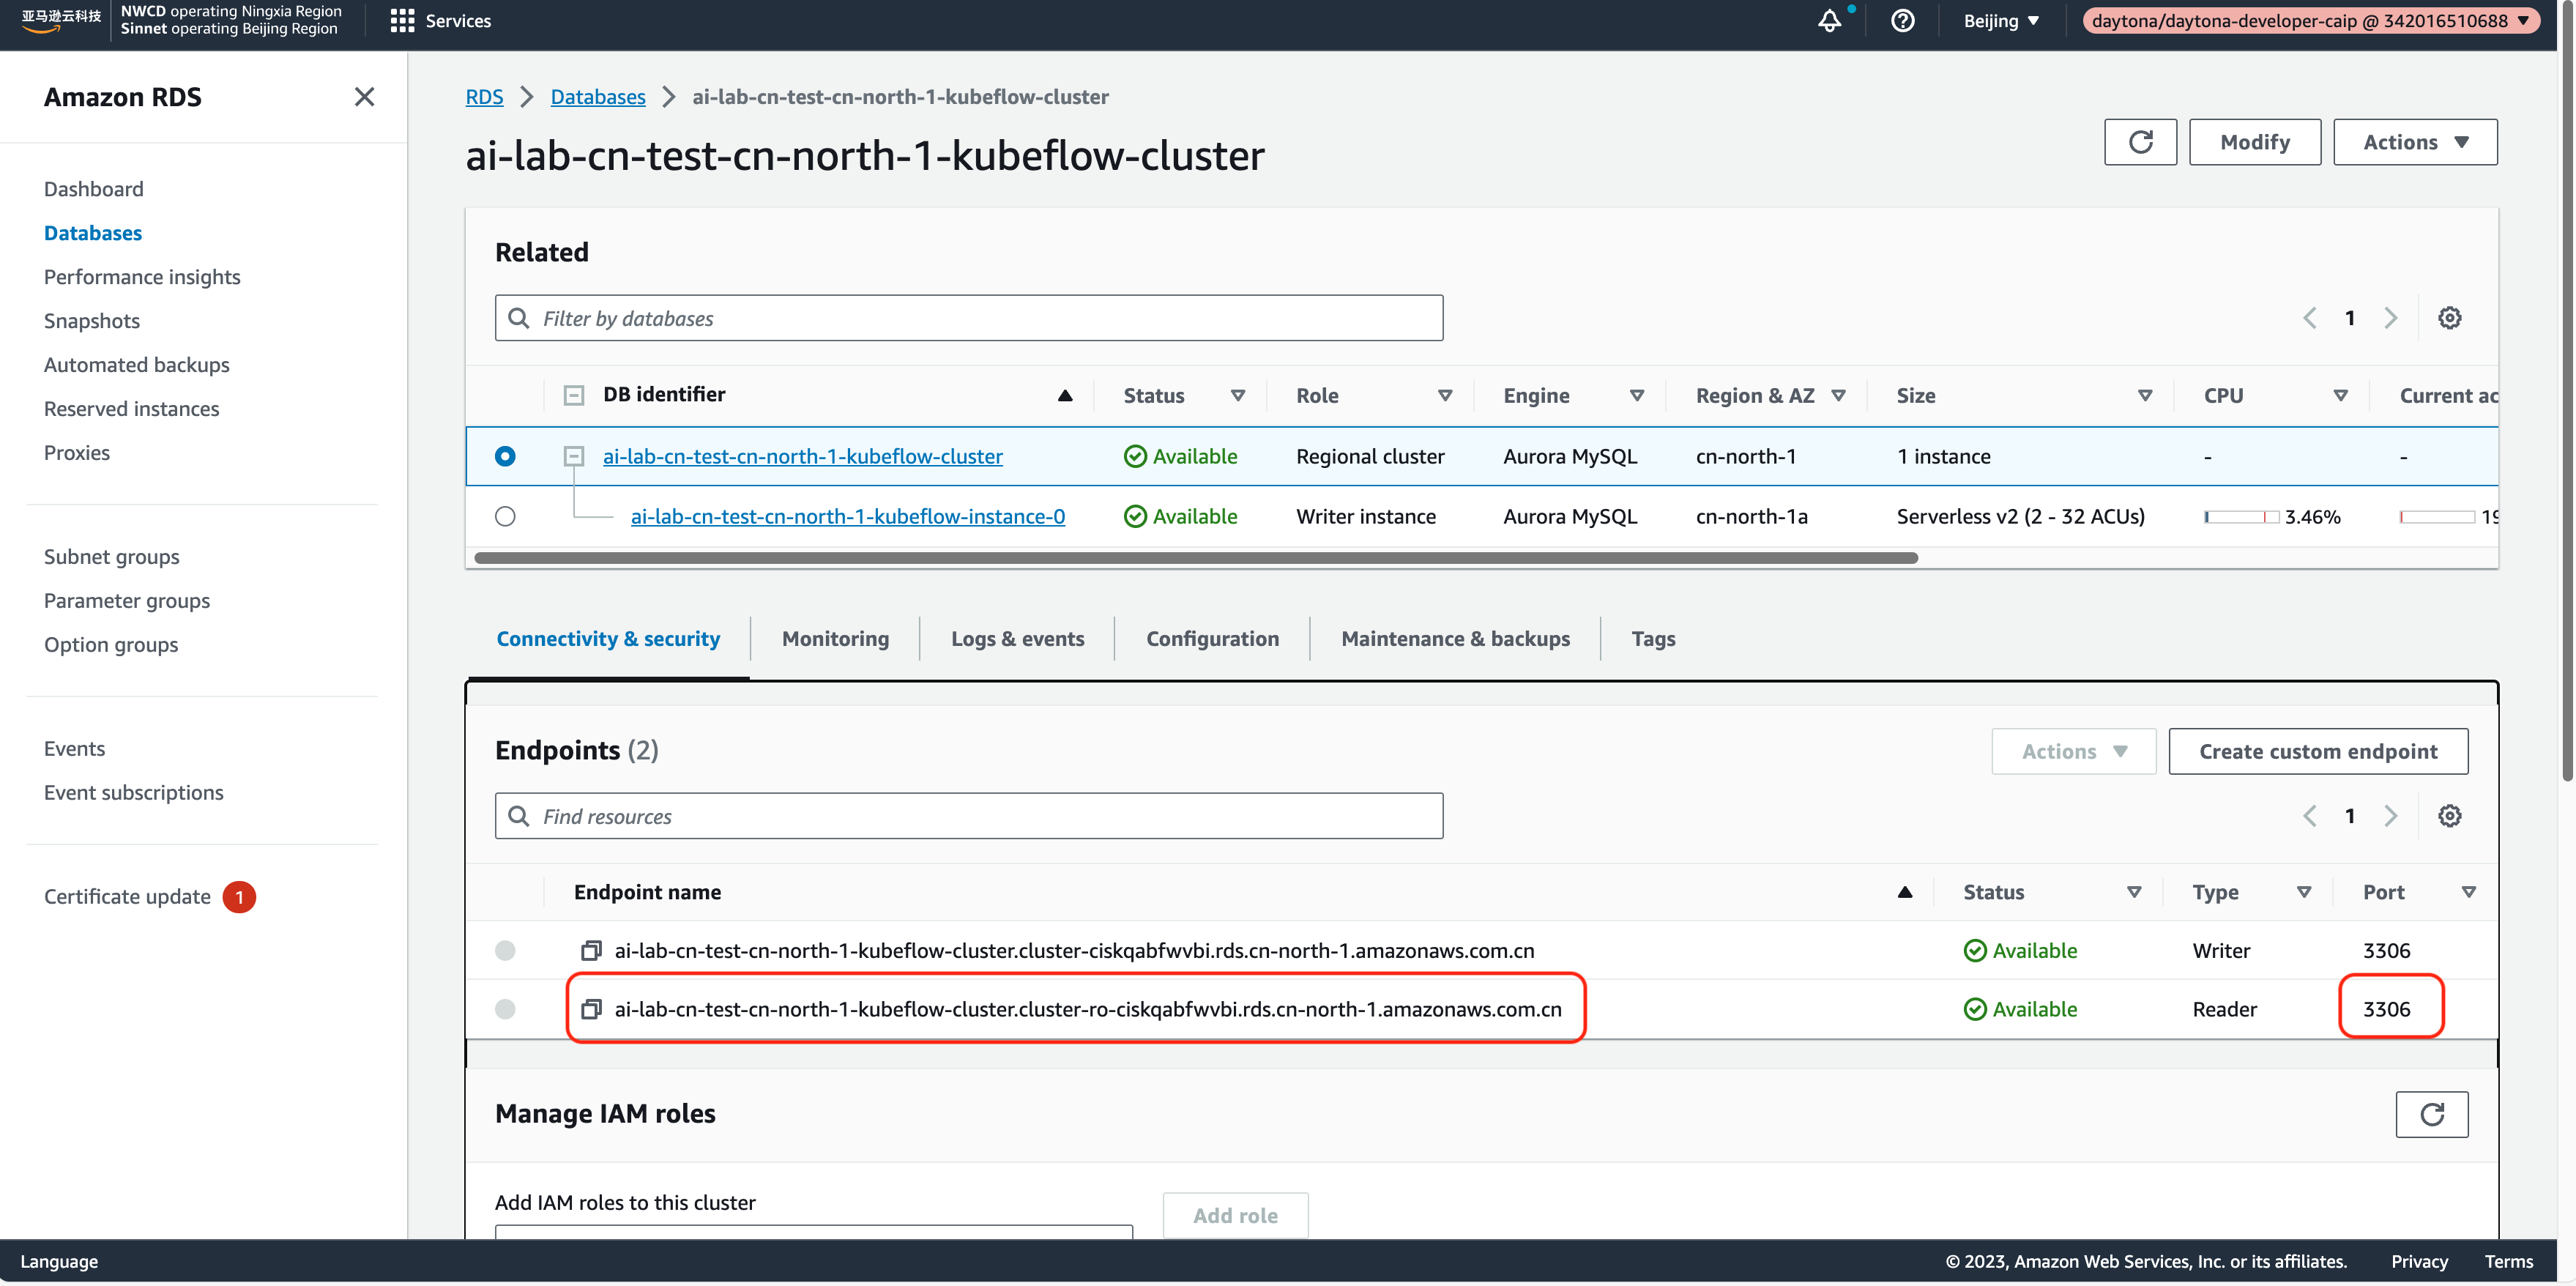
Get Your AWS RDS Information
Get your AWS RDS cluster information: endpoint, port, user, and password.
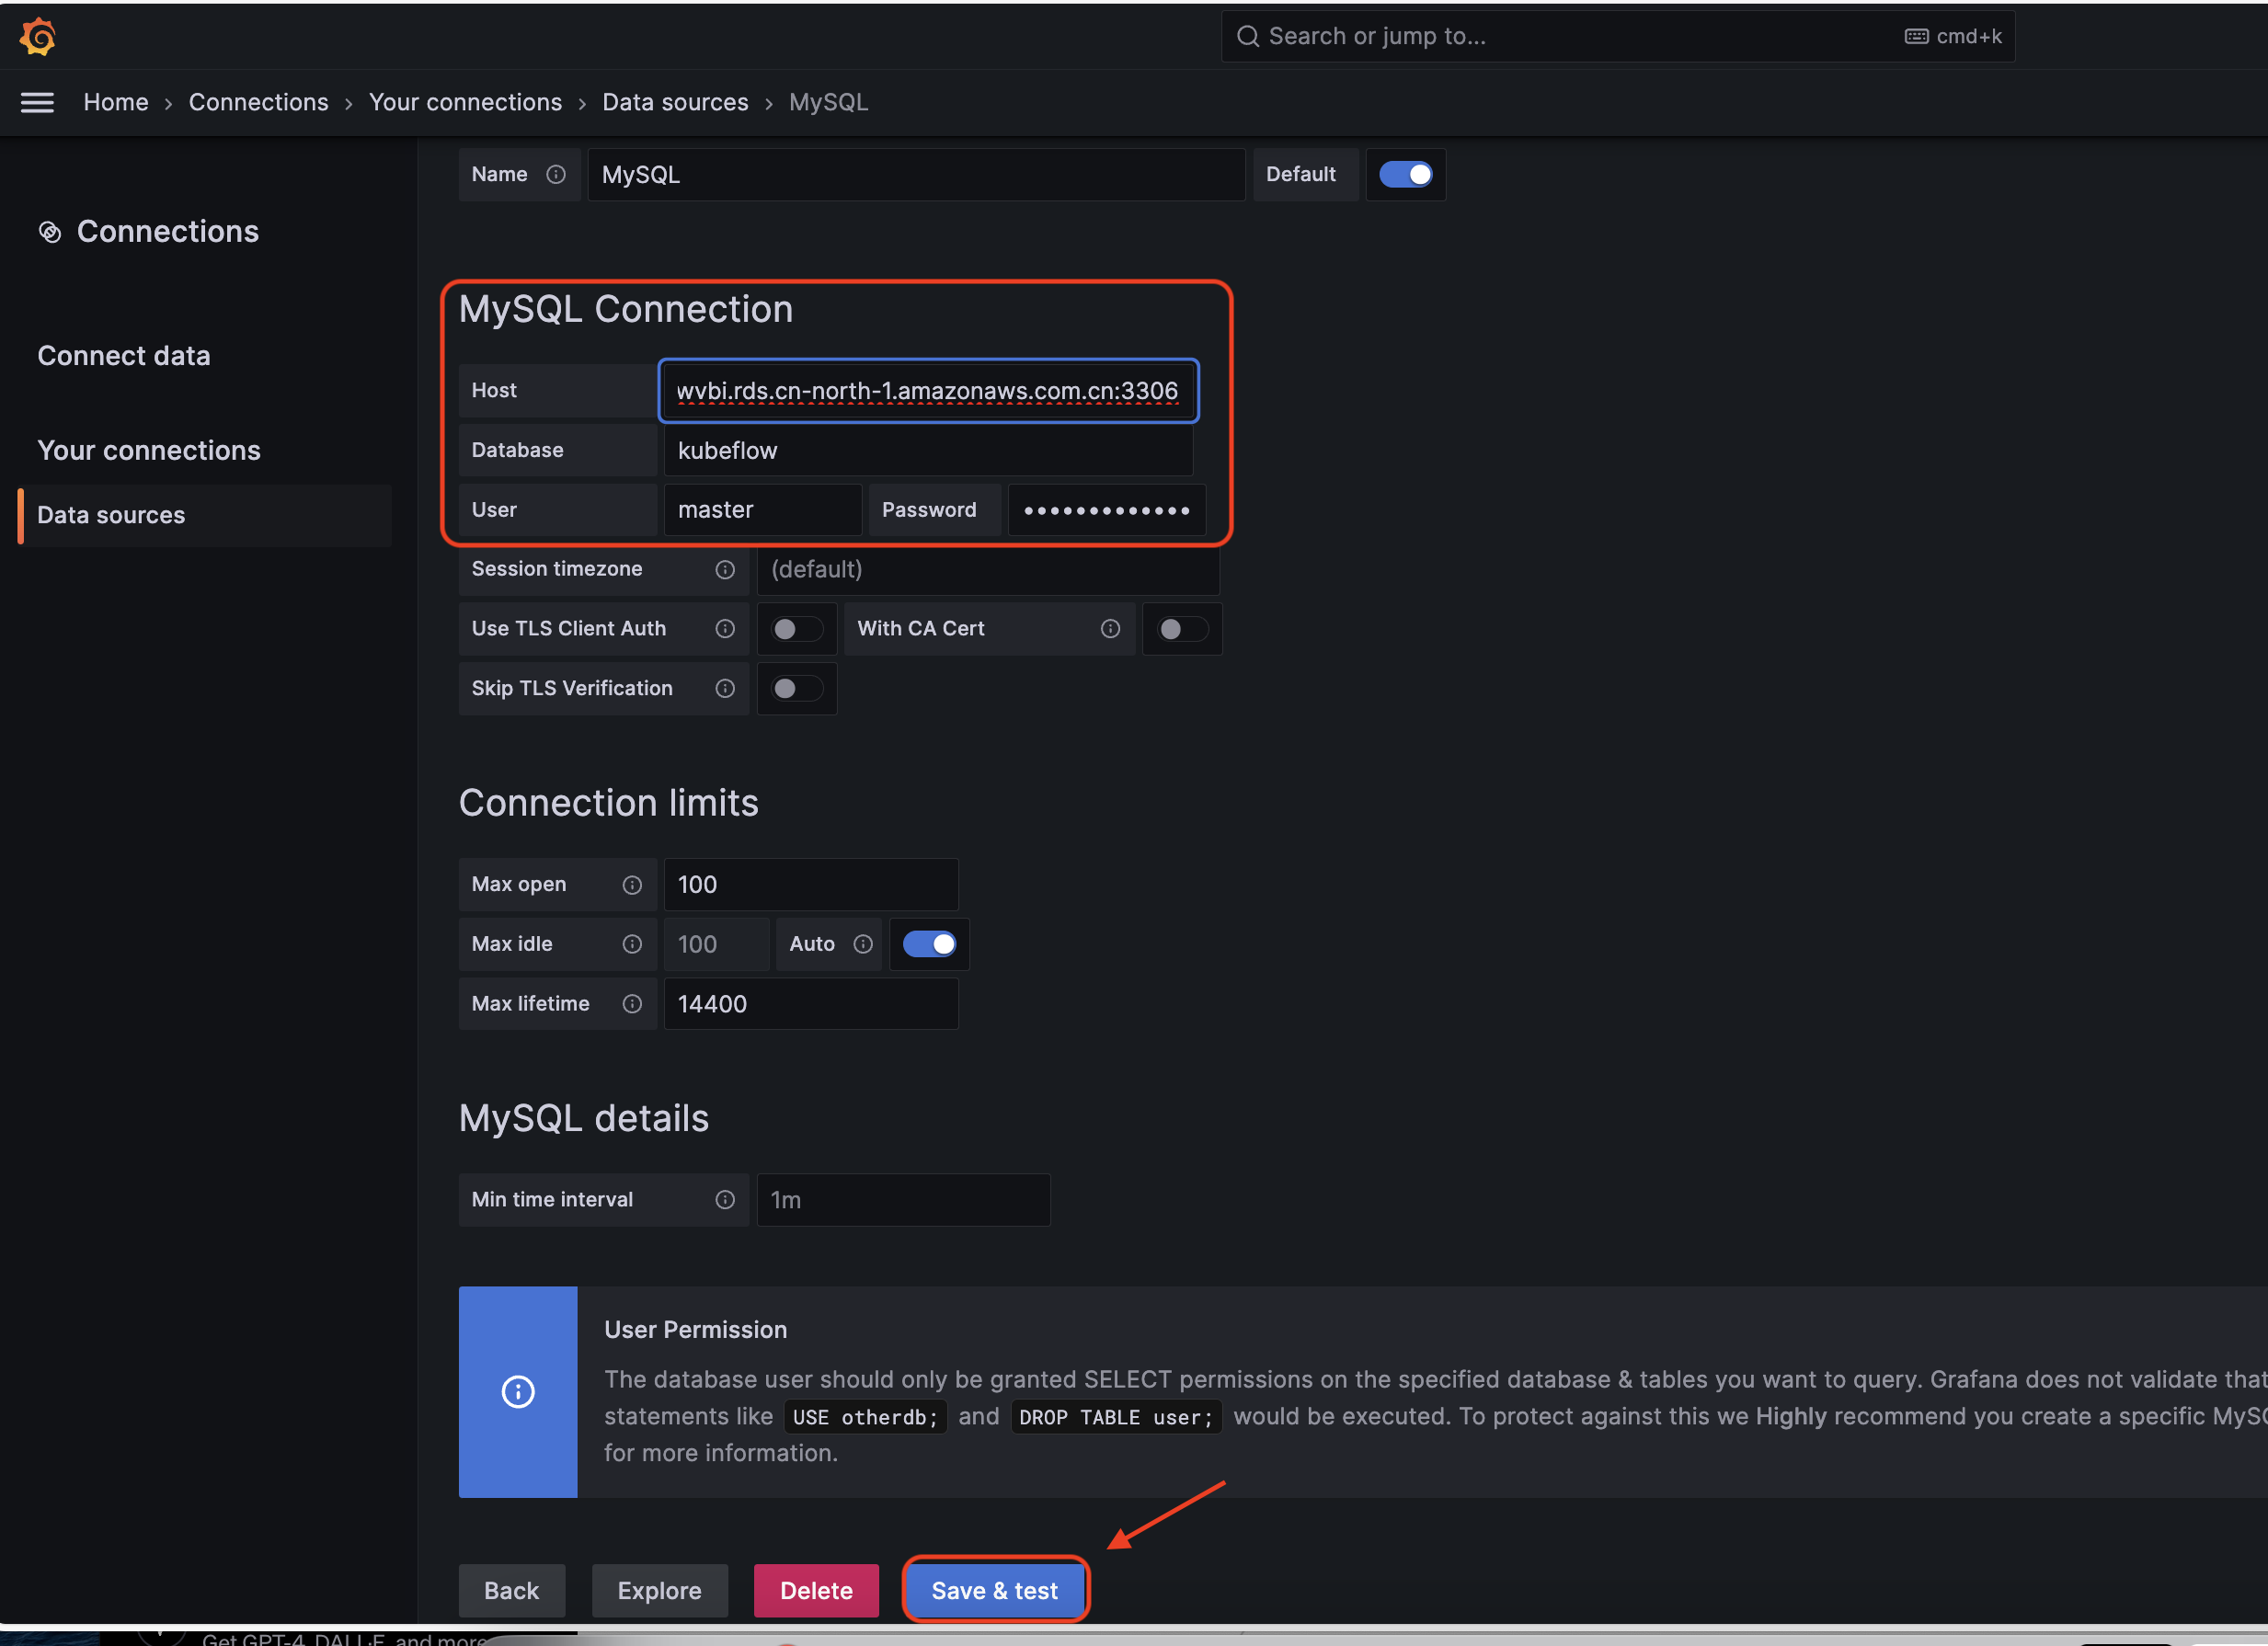
Configure Your Connection
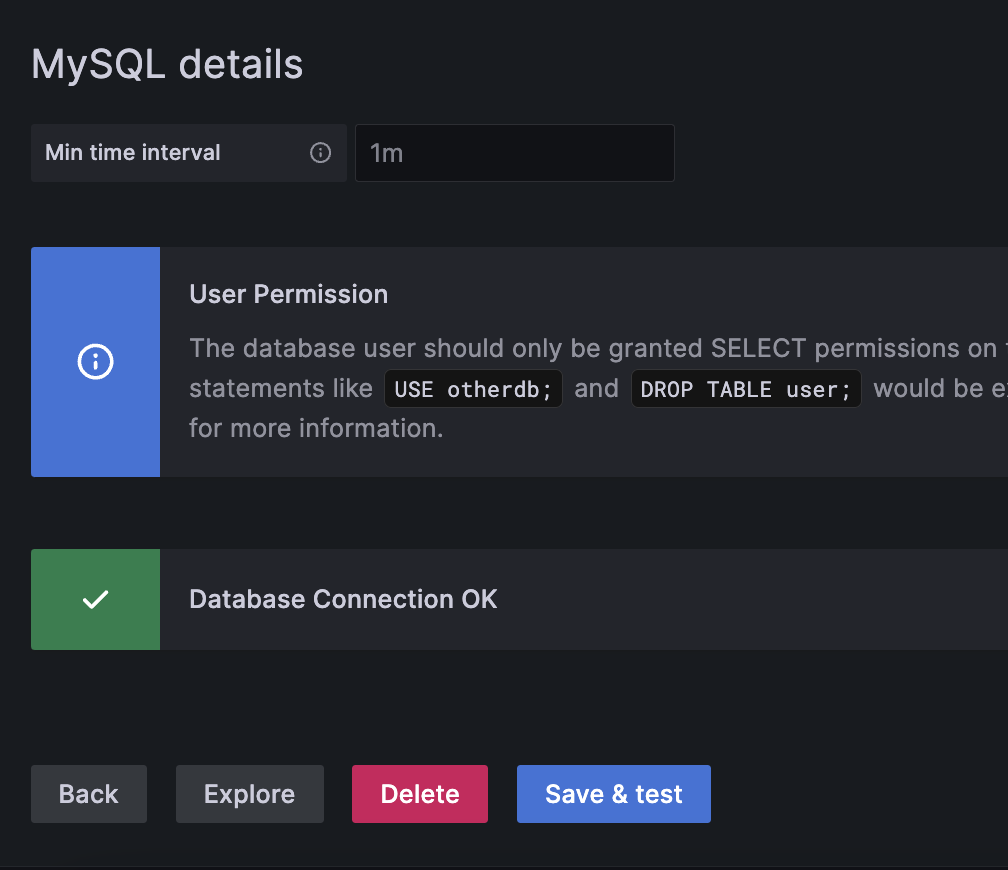
Fill in the relevant database information in the configuration and click "Save & Test".
If everything goes well, you will get the notification: "Database Connection OK"
Test Your MySQL Data Source
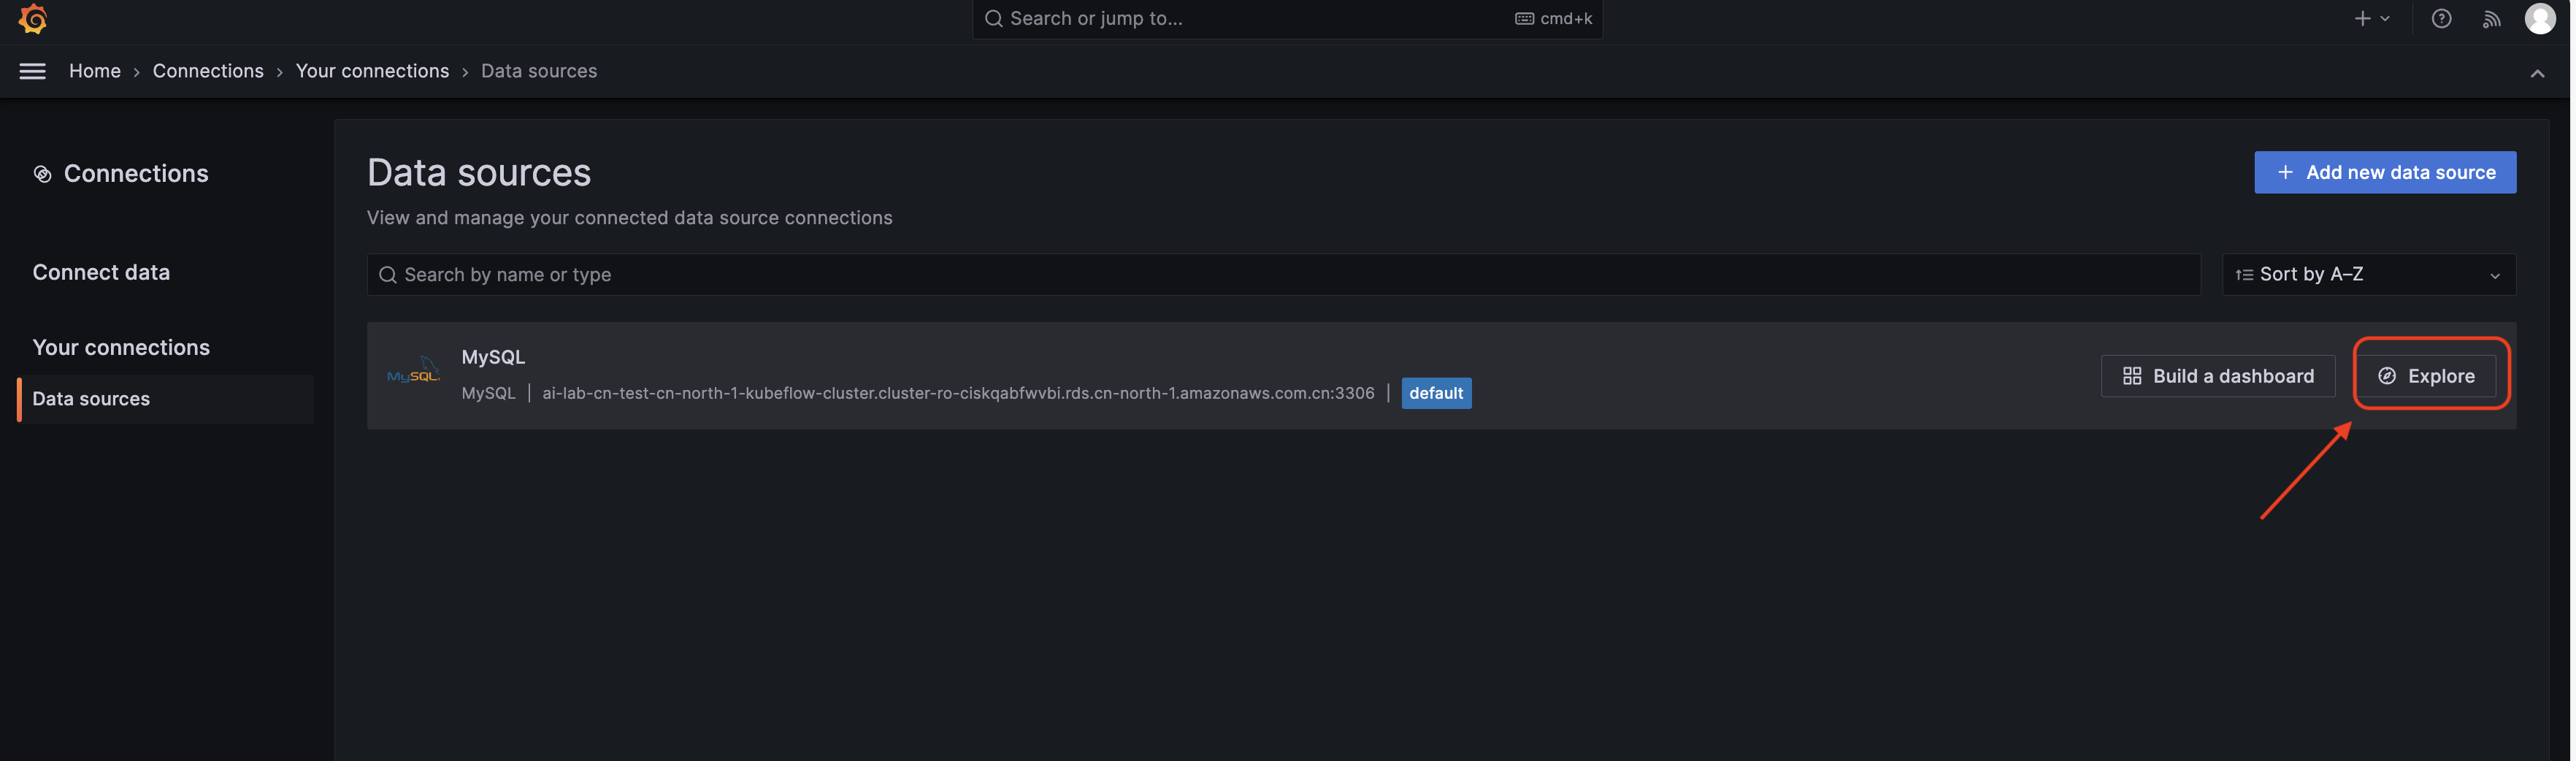
After completing the configuration, you will see the database you just added in your data sources list. Click on 'Explore' to conduct a test.
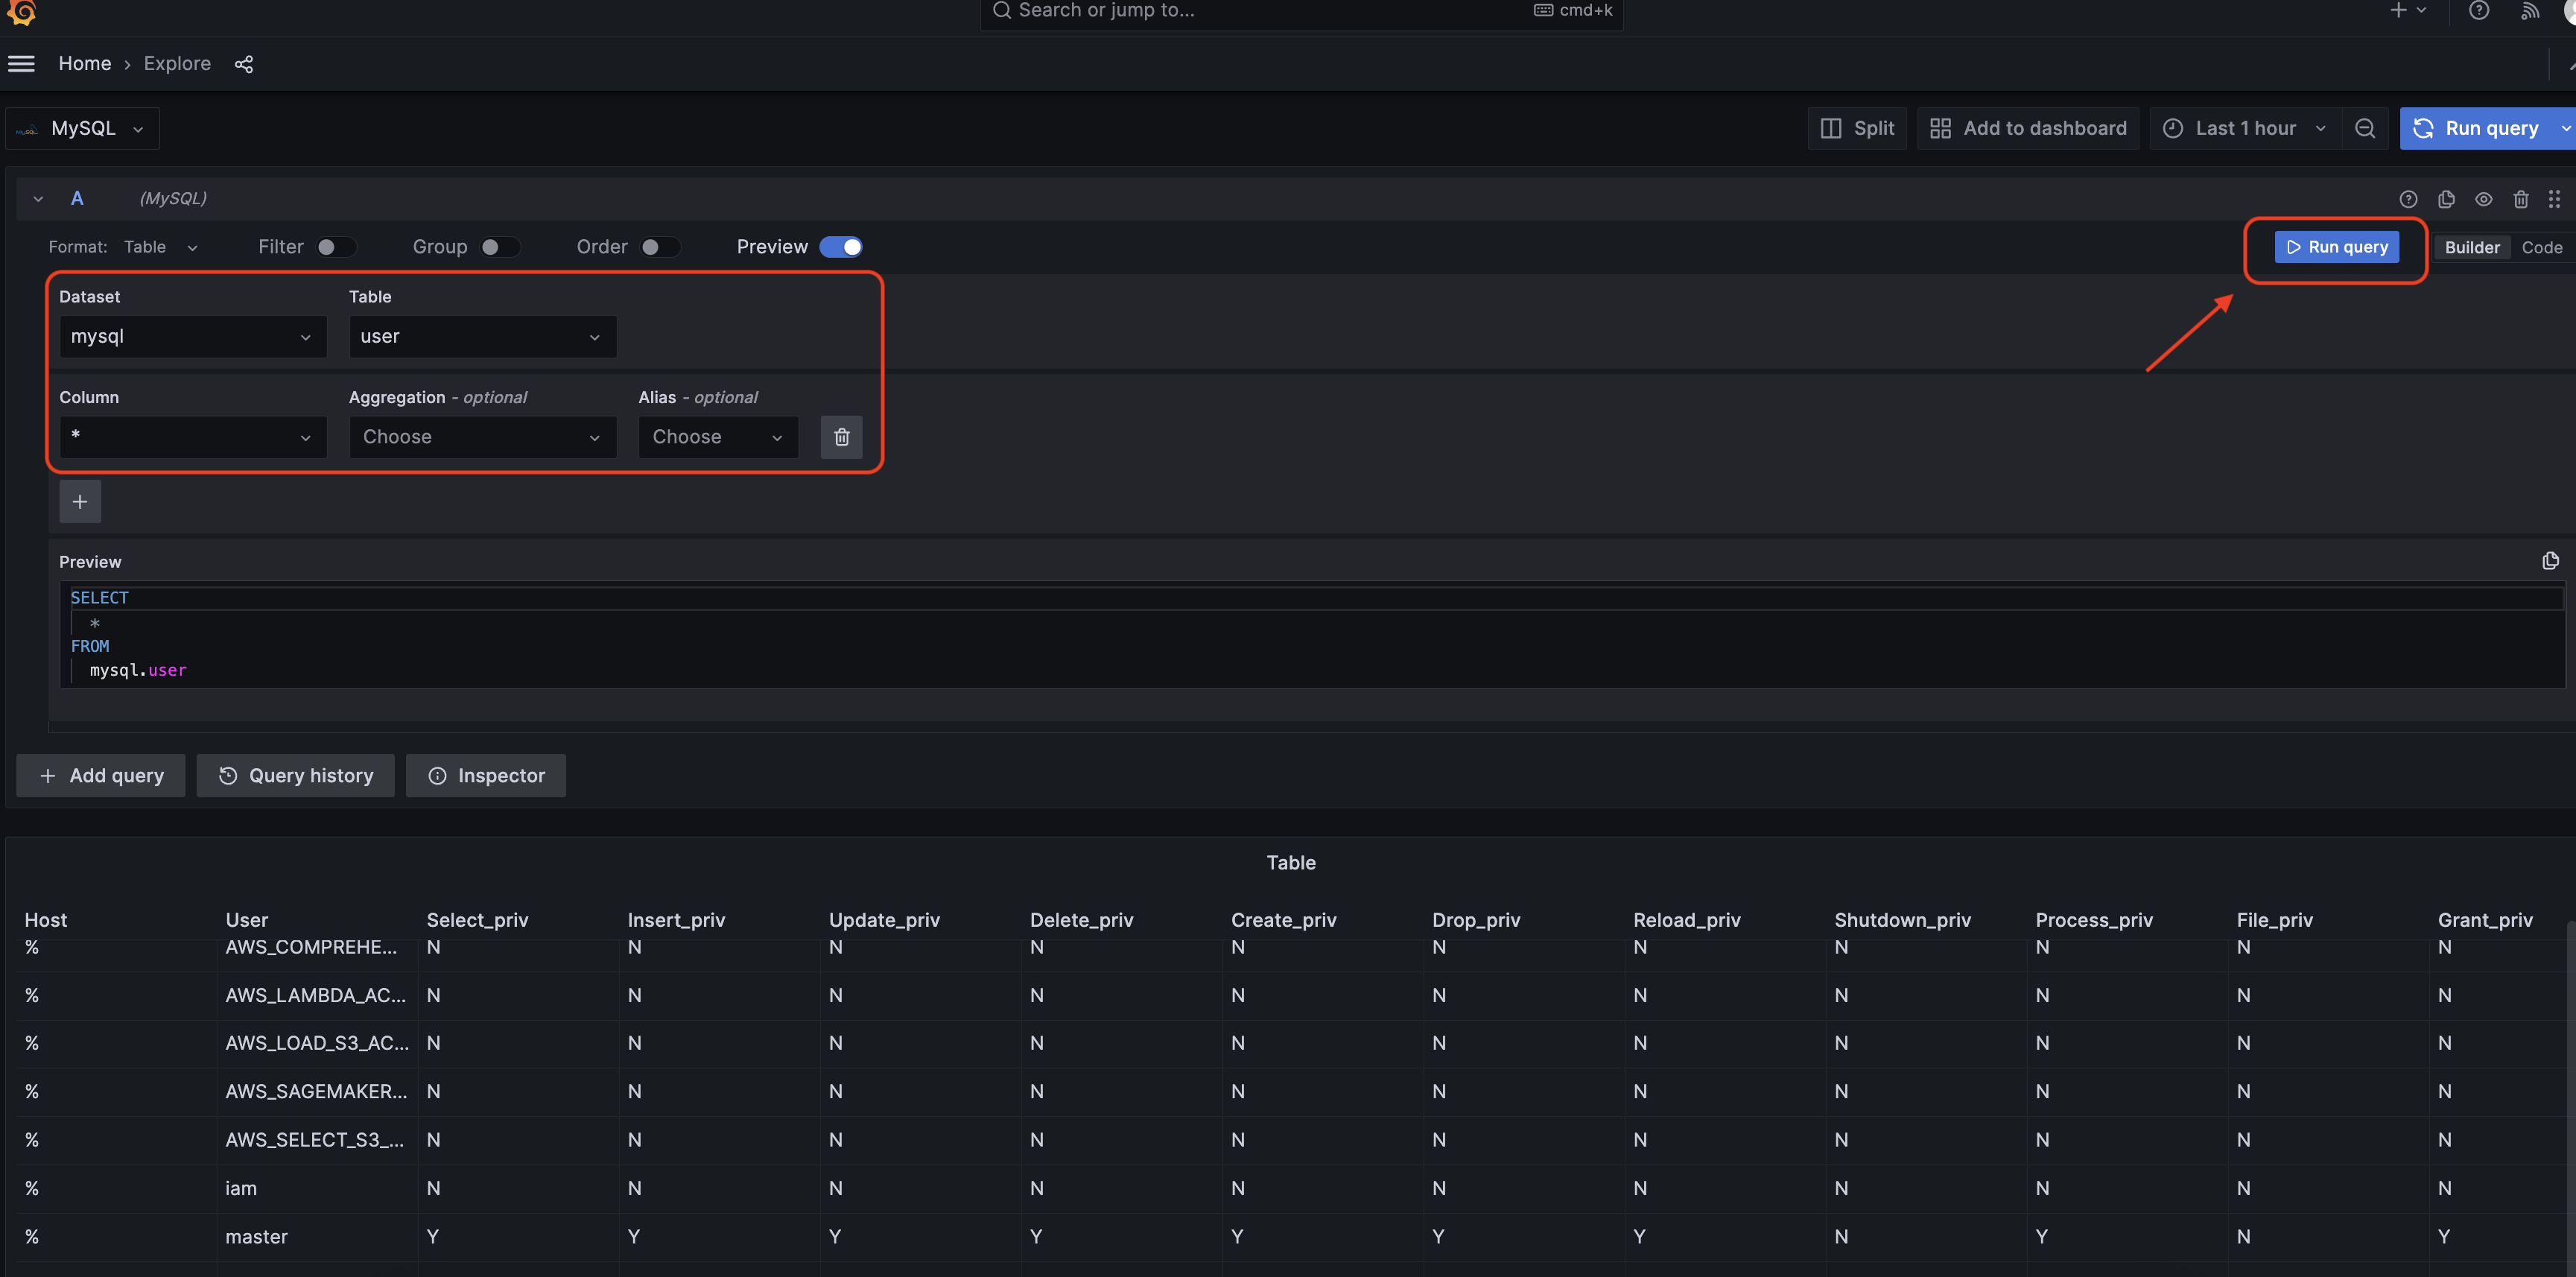
Simply input some query parameters, and then click 'Run query,' and you will be able to retrieve data successfully.
Key Features:
- Direct connection to managed relational databases
- Real-time monitoring of database performance
- Custom metrics and alerting on database health
- Integration with existing database infrastructure
Custom Plugin Requests
In case of need of another plugin, please follow the official documentation: Grafana Plugins - extend and customize your Grafana.
Creating Snapshots
If you want to share your Grafana data with other users, we recommend utilizing Grafana's snapshot feature.
What are Grafana snapshots?
Grafana snapshot is a feature that allows users to capture the current state of a Grafana dashboard at a specific moment in time and share it as a publicly accessible, interactive web page. This feature creates a static representation of the dashboard, including all its visualizations, panels, and configurations, without exposing the underlying data sources or sensitive configuration information. By generating a unique URL, Grafana snapshots enable users to instantly share the dashboard's visual representation with anyone, even those without access to the Grafana server or dashboard permissions. While the data within the snapshot is not dynamic and won't update over time, it provides a convenient way to showcase dashboard insights, collaborate with team members, or demonstrate dashboard functionality to stakeholders.
Related official link: Publish a snapshot
How to use it?
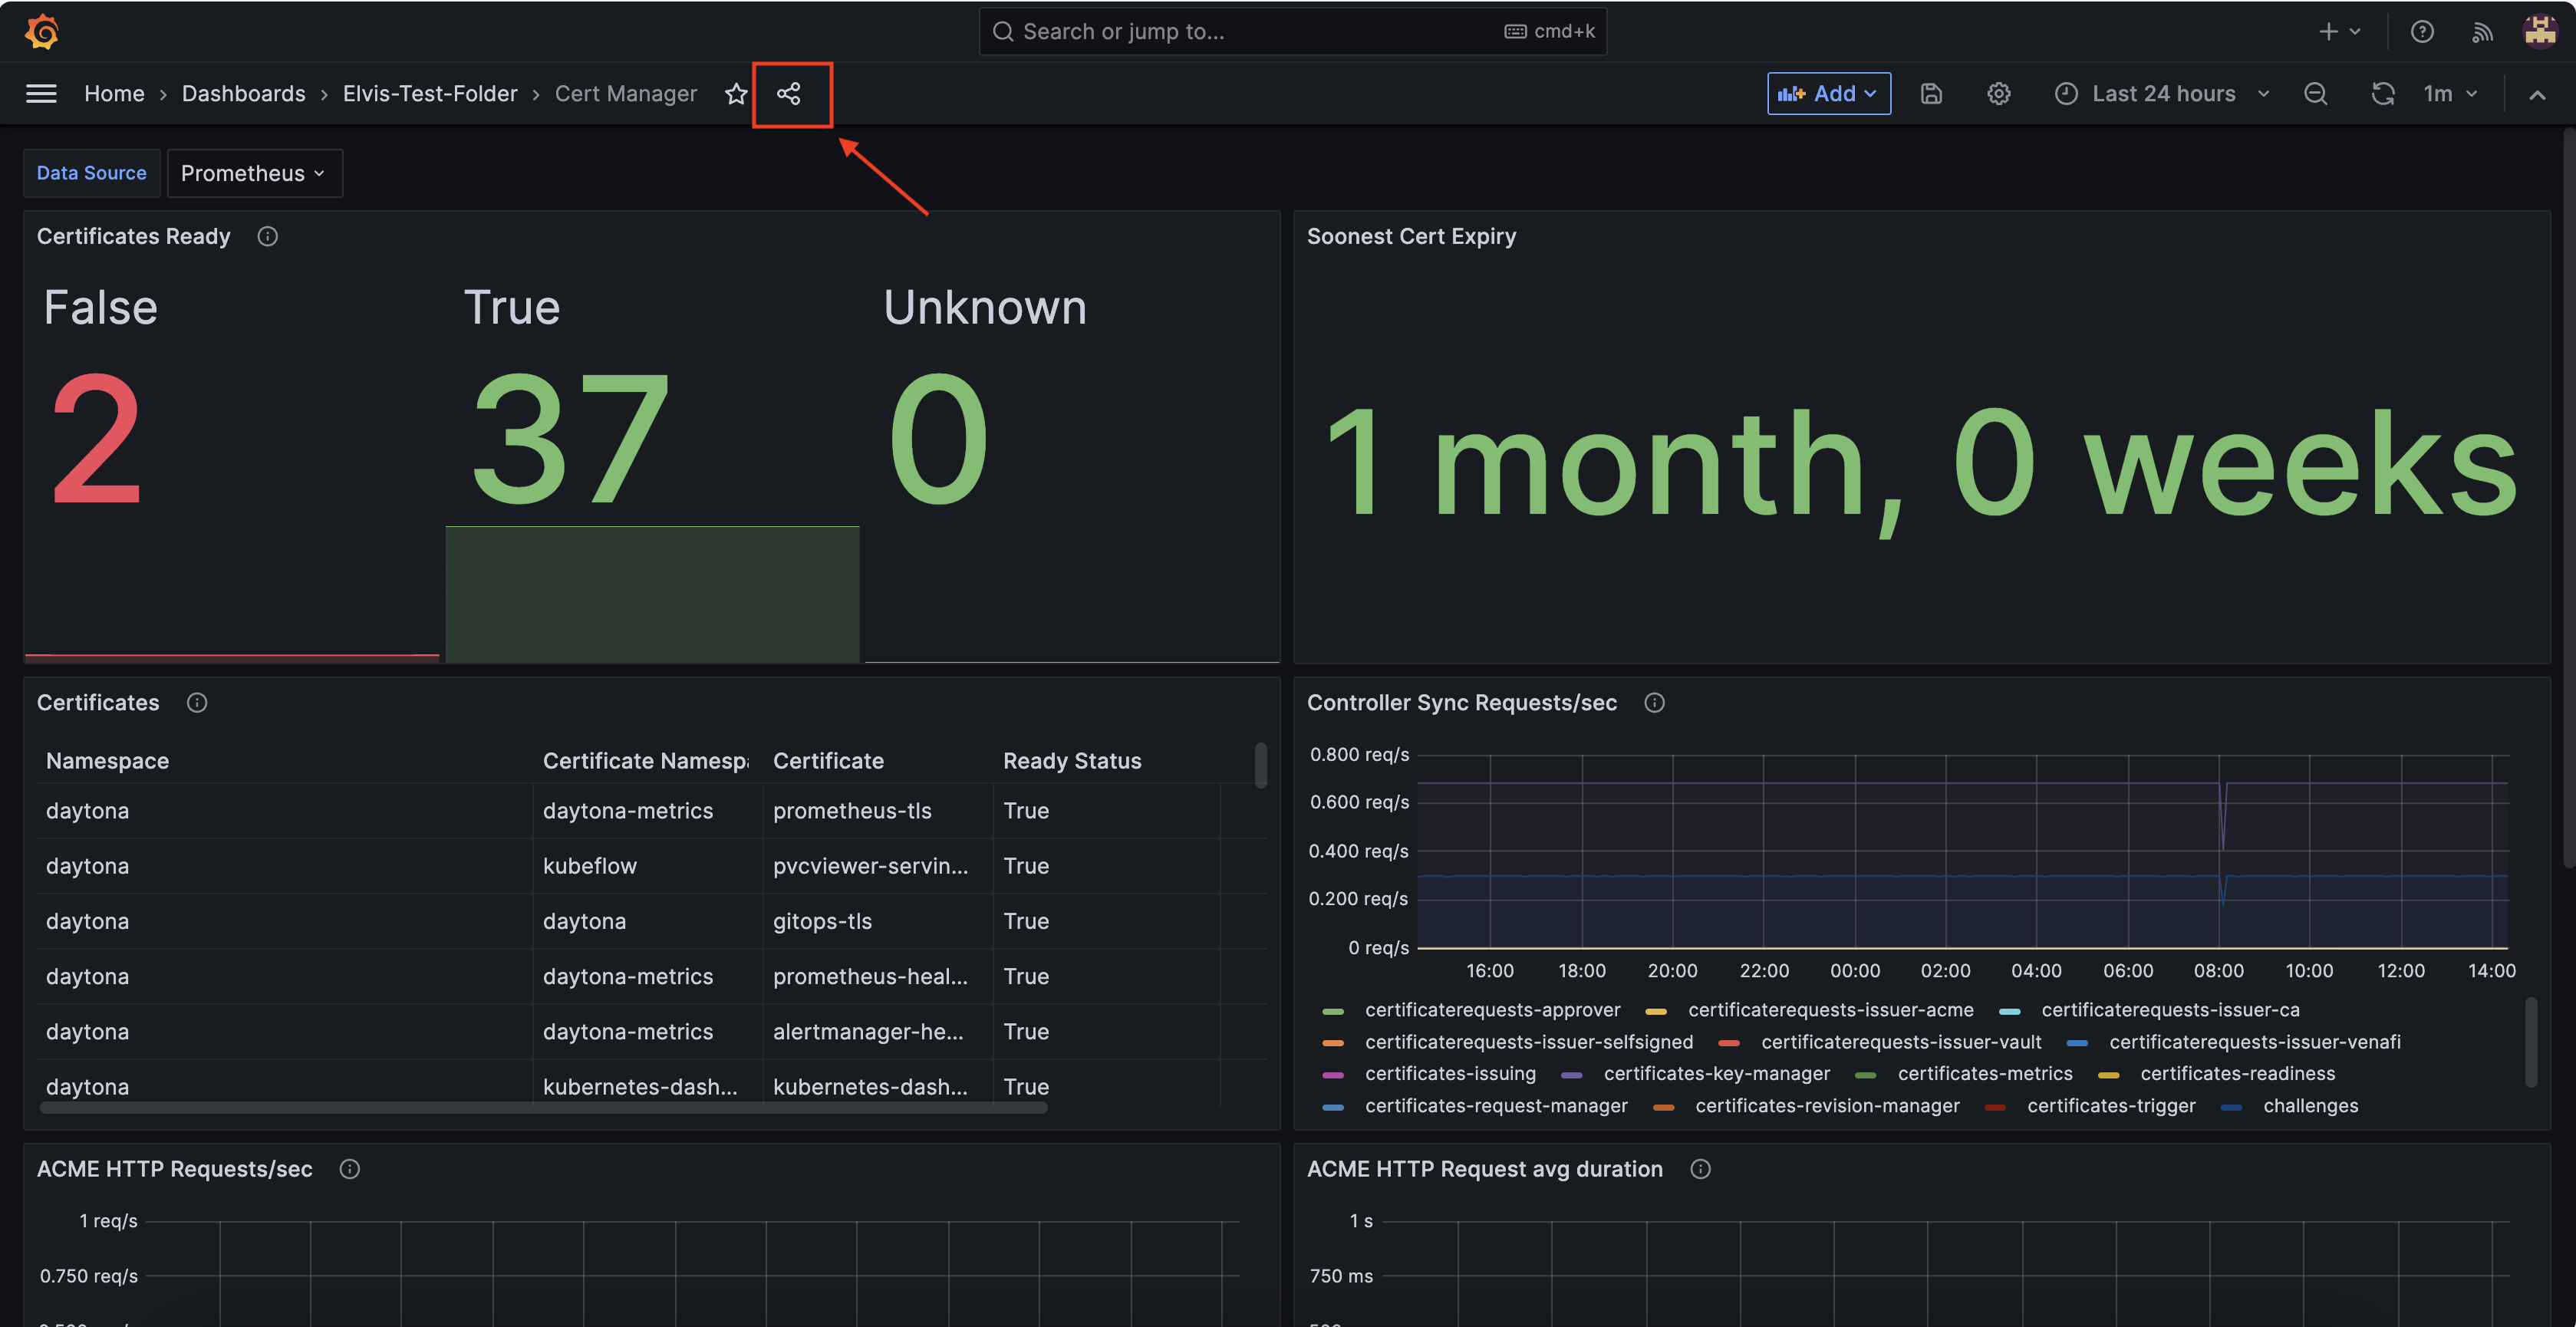
Open the dashboard you want to share and click the share icon:
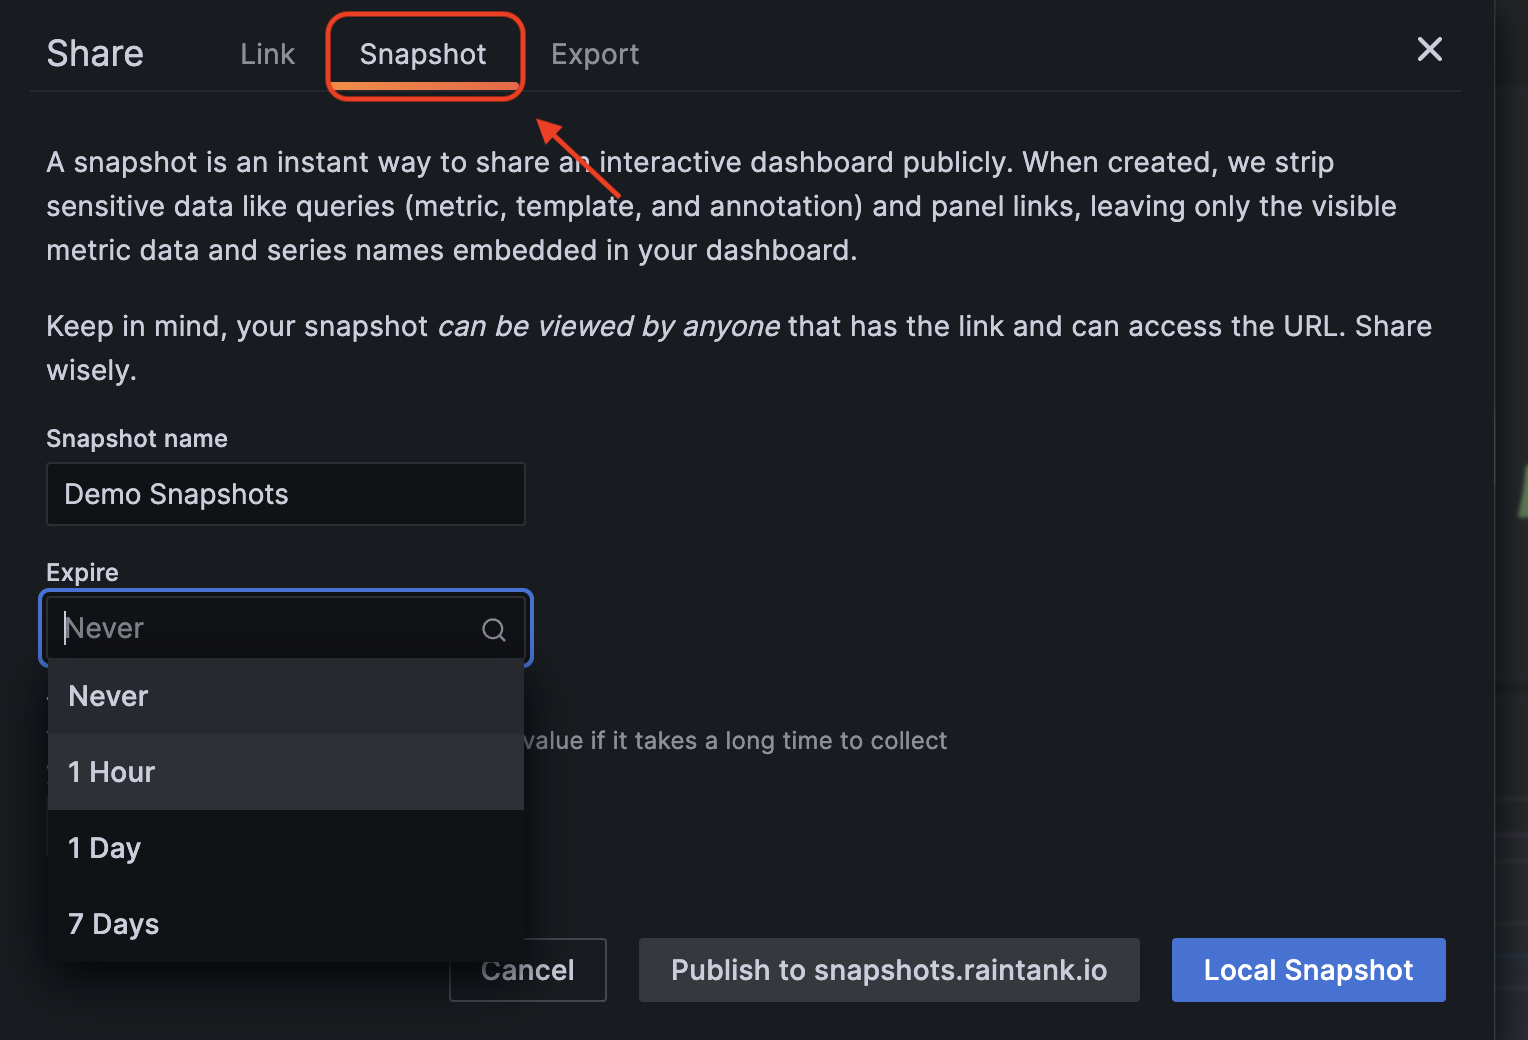
Switch to the "snapshot" menu and input the name and expire time based on your requirements:
Tips: When you create your snapshots, you can choose publish to your local instance or "snapshots.raintank.io", which is a free service provided by Grafana Labs that enables you to publish dashboard snapshots to an external Grafana instance. Anyone with the link can view it.
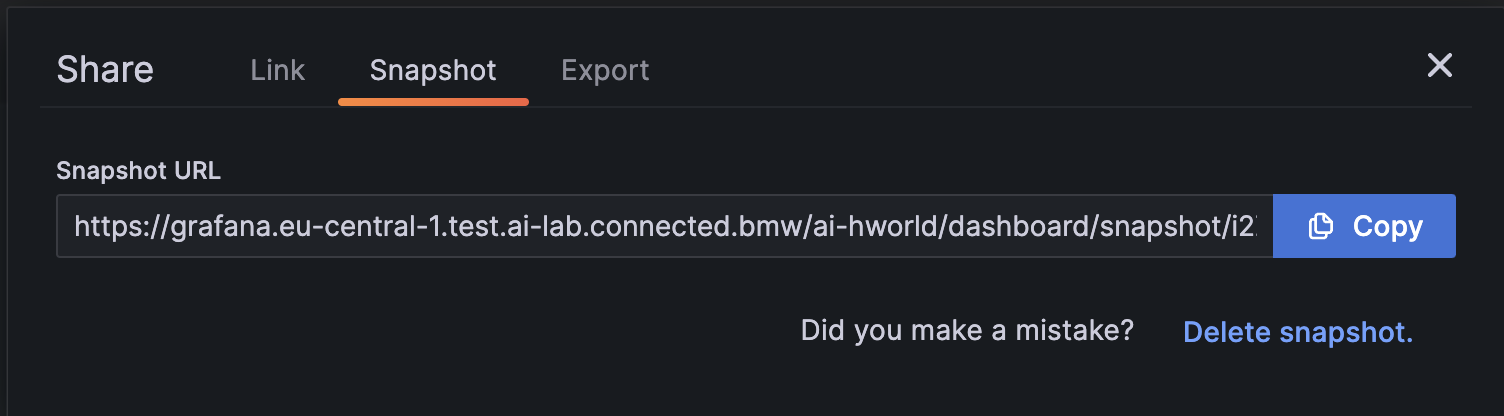
And then you will get the unique link, copy and share it with others:
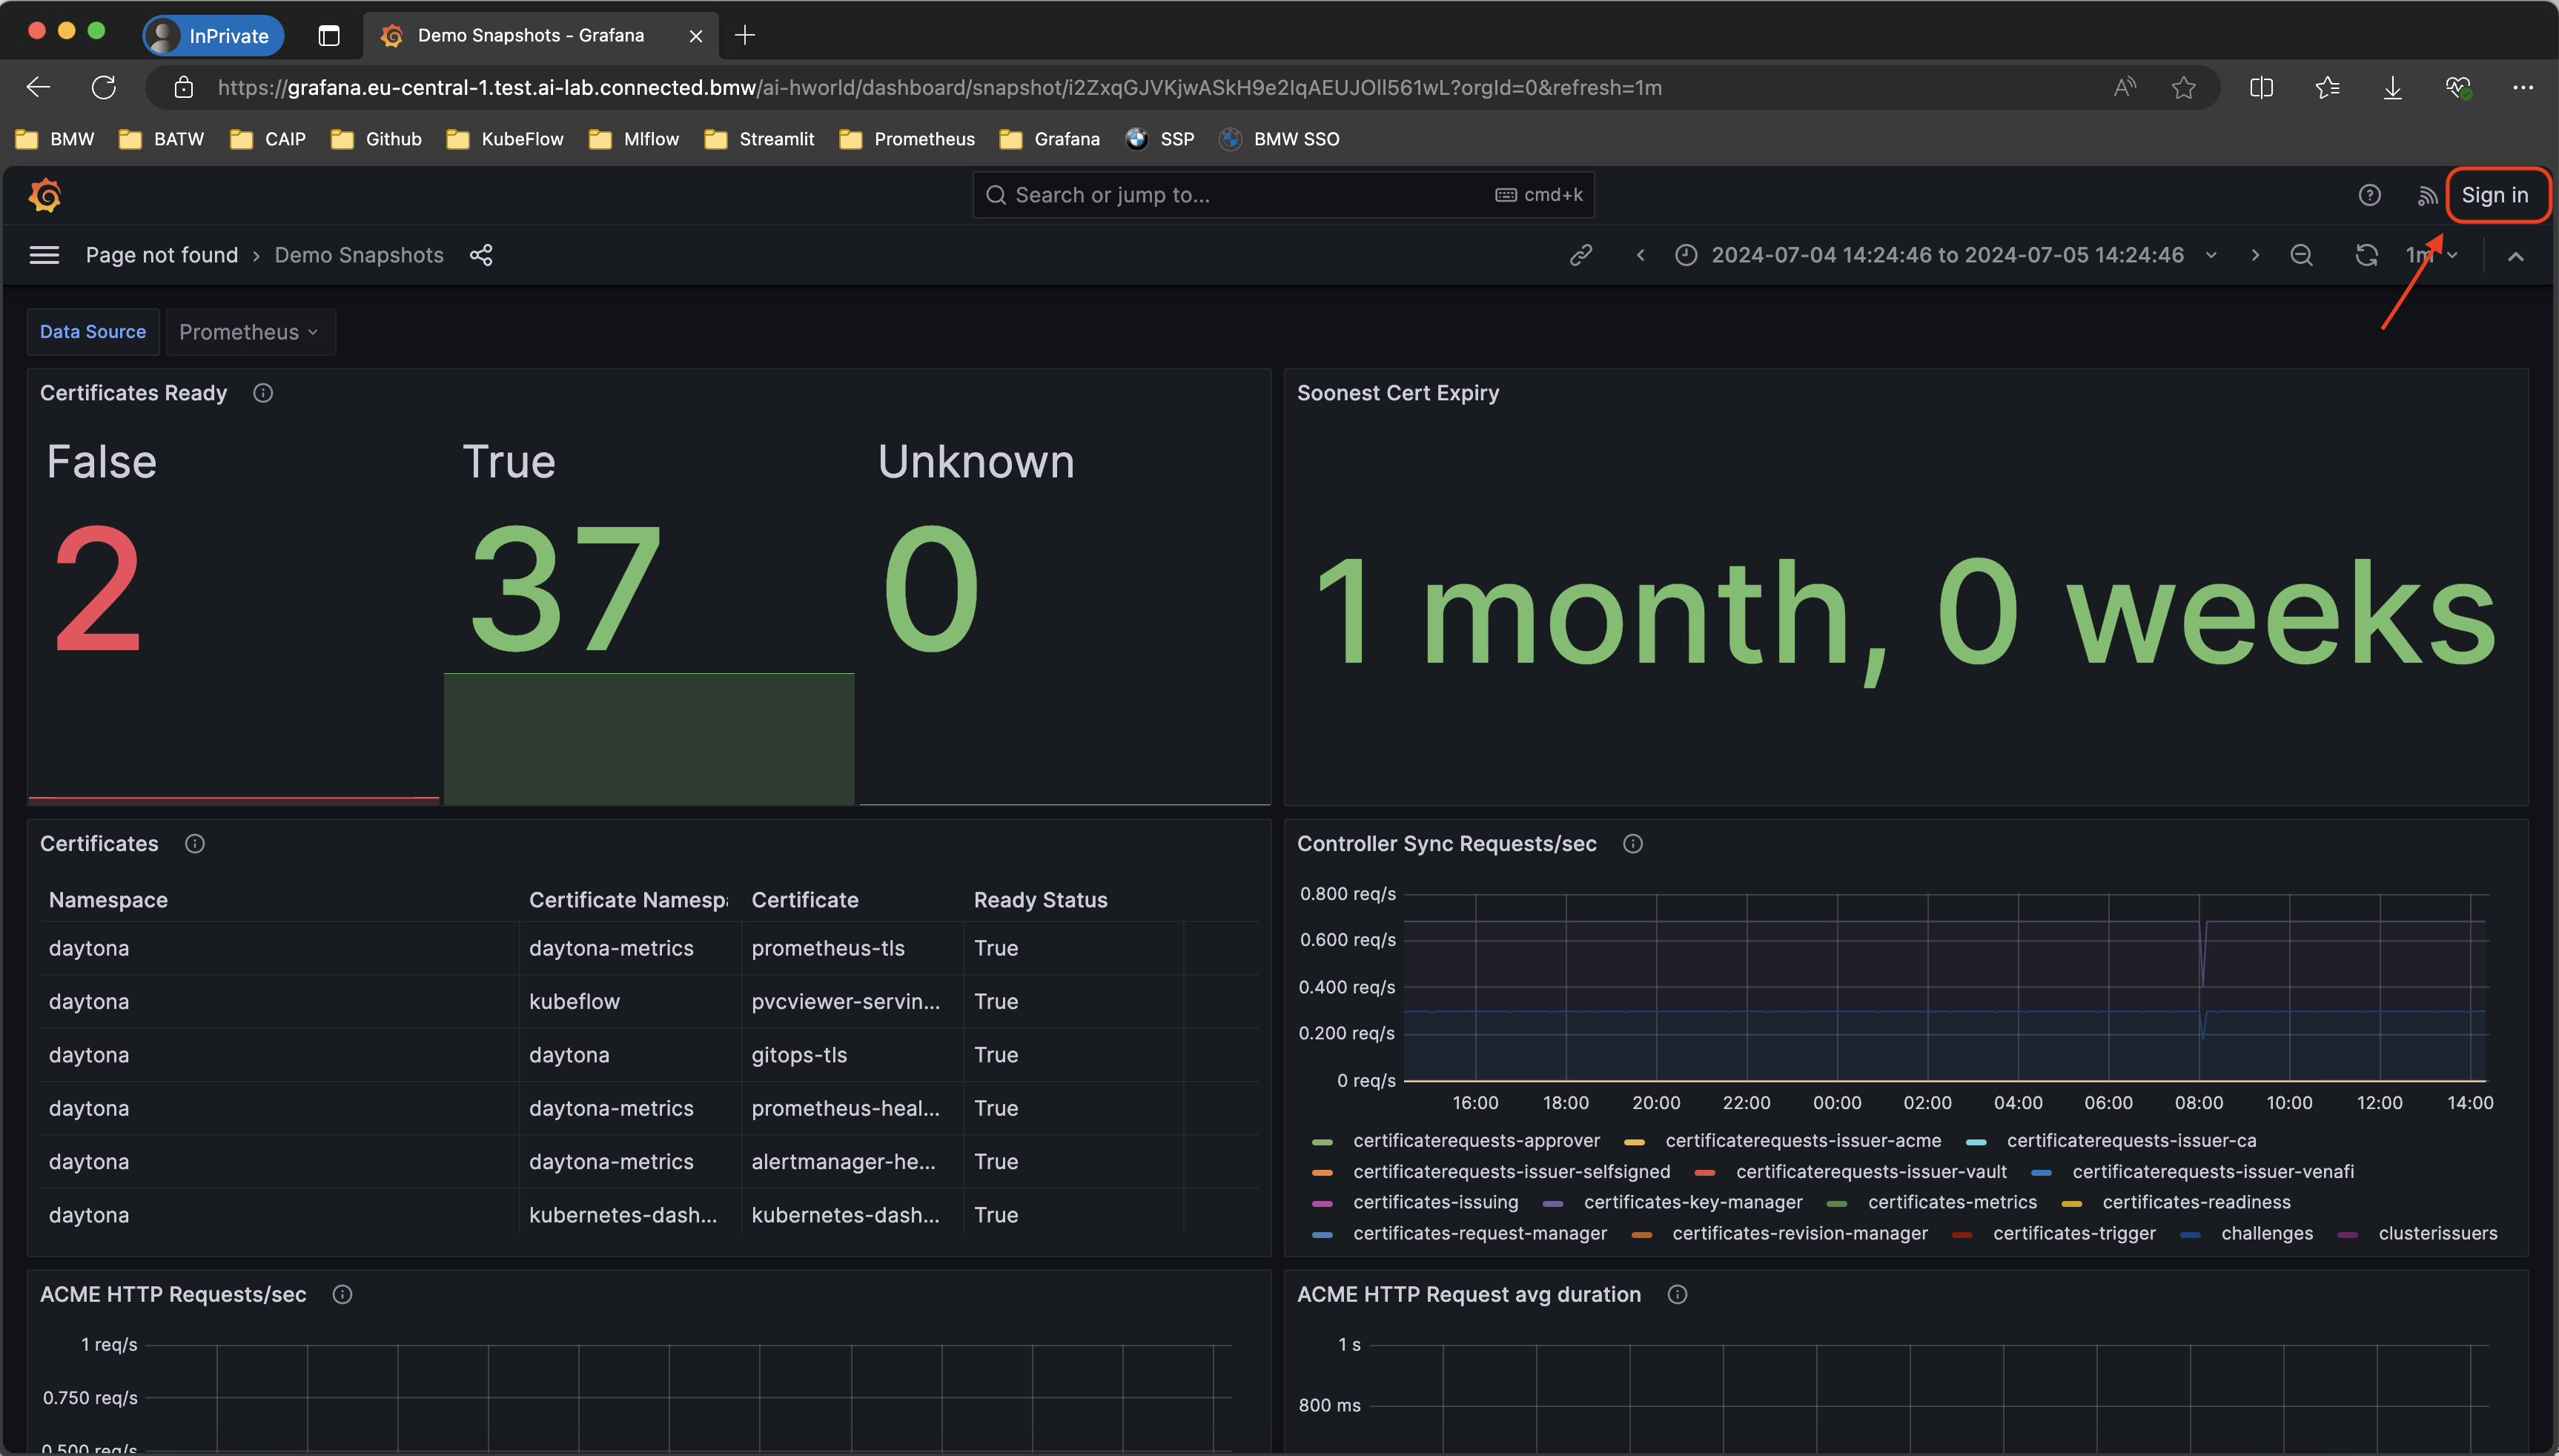
Let's try to access it, and you can see, I accessed it successfully with a private page and also didn't log in the Grafana:
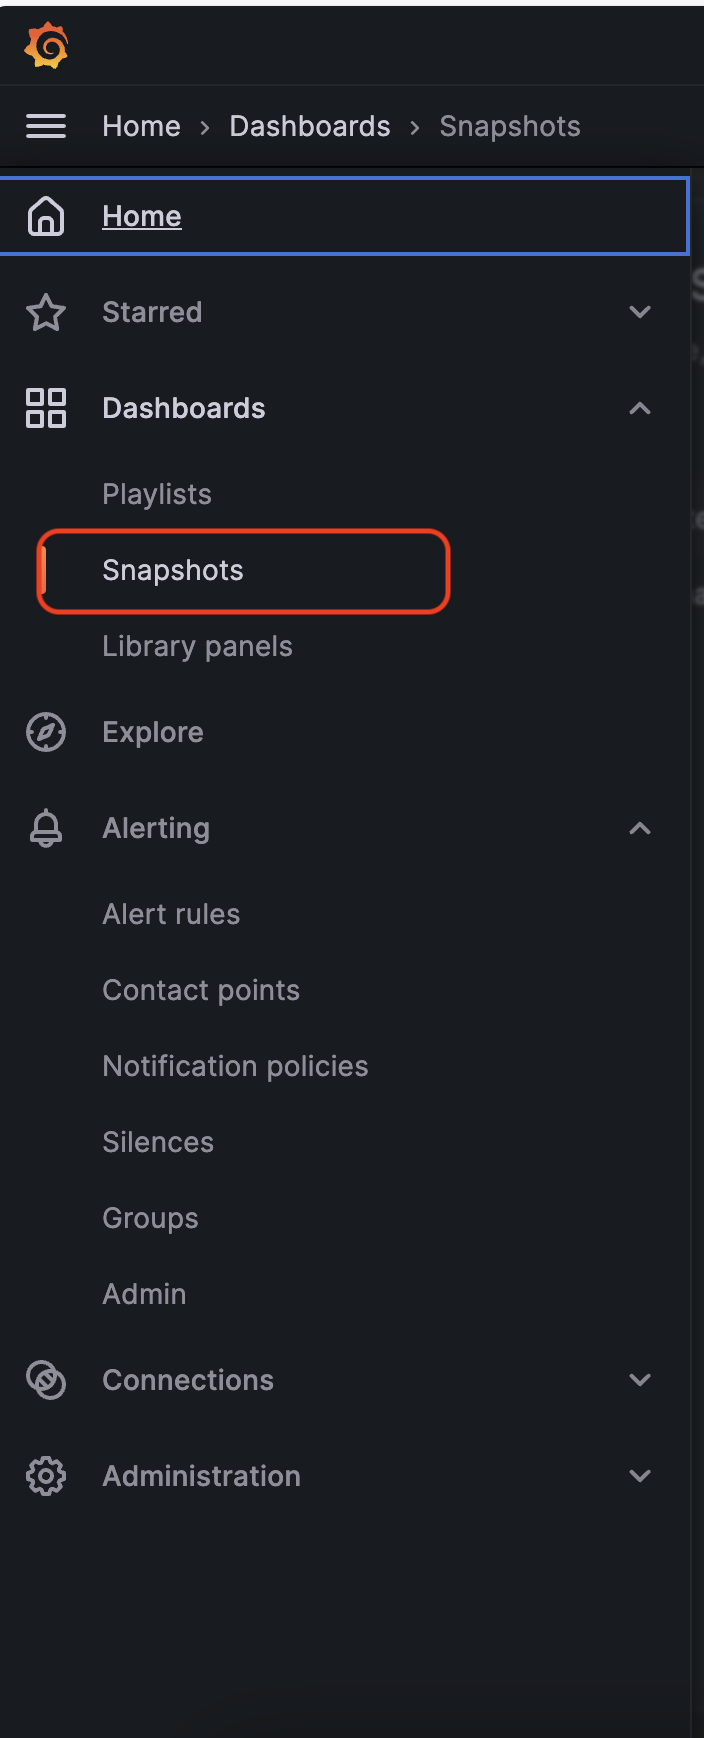
And at last, if you want to manage your snapshots, you can access it from this submenu:
Dashboards
Automated Dashboard Deployment
In case you want to deploy a custom Grafana dashboard via code instead of using Grafana UI, please follow this guide.
Once configured, the dashboard will appear in your Grafana instance.
CDLS - BMW Internal Logging
CDLS is a core feature that enables log aggregation, which is essential for monitoring and debugging pipeline execution. Refer to the example for a working simple pipeline with CDLS log propagation.
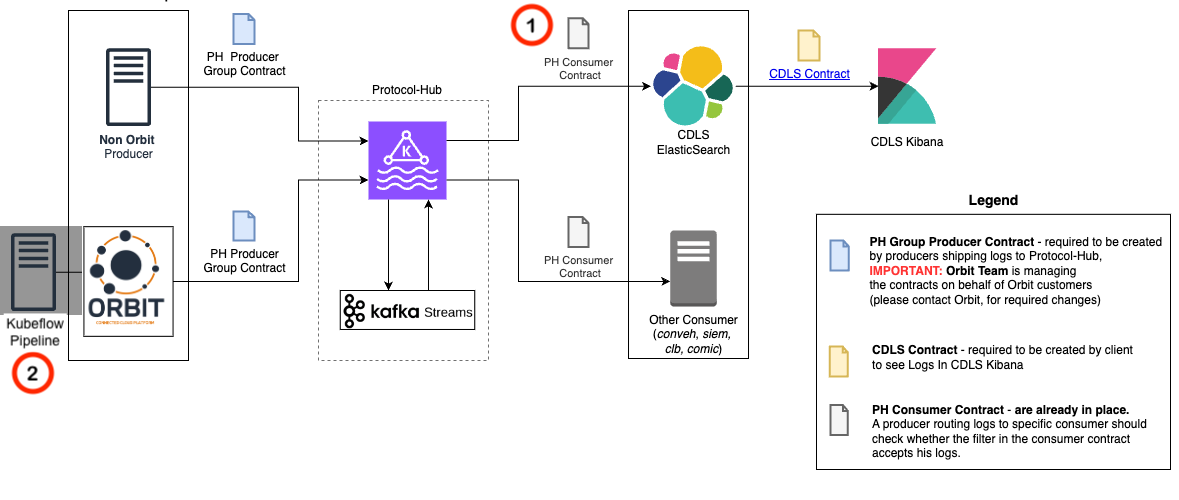
Overview of Initial Setup
Looking into the Integration Guide in CDLS' User Handbook, you can see the wholistic setup is relatively complicated and multiple parties are involved. Luckily most of the heavy lifting is already done by Orbit and on your end you have to take care of only two things:
- Setting up the CDLS Contract
- Configuring your Kubeflow pipeline to log in a CDLS compatible format and to forward the logs
(1) CDLS Contract
Use Cases need to request a CDLS contract in the Interface Contract Management system using the CAIP contract for reference. Importantly, the contract defines the log group name and app id which are then used to write the logs out to then see in Kibana and isolate access.
(2) Exposing your Pipeline Logs
To ensure all pipeline logs are forwarded to CDLS, there are two steps essential:
- Pod Labels: The Kubeflow Pipeline steps (aka. Kubernetes pods) need to have specific CDLS labels, so that Orbit observes the pod and forwards the log messages written to standard out to CDLS.
- Log Format: Your log messages must be in a CDLS compatible format so that they can be parsed and you can later filter for it.
An example pipeline implementing both can be found in our examples repository.
2.1 Add Pod Labels
To ensure pod logs get forwarded following the integration architecture to ELK, they need to be labelled for CDLS. In terms of Kubeflow Pipelines, we need to configure these values:
data_transformation_step.add_pod_label("CDLL_APP_ID", "MY_MICROSERVICE_ID")  # needs to be the Microservice ID specified in the CDLS contract. NOT THE APP ID!
data_transformation_step.add_pod_label("CDLL_ENVIRONMENT", "test")
data_transformation_step.add_pod_label("CDLL_HUB", "eu-central-1")  # the AWS region, as opposed to a Hub, such as EMEA
2.2 Format Logs in CDLS Compatible JSON
Logs have to be JSON records of this schema with example values:
{
    "appID": "MY_MICROSERVICE_ID",  // as specified in the CDLS contract
    "hub": "eu-central-1",          // the AWS region, as opposed to a Hub
    "environment": "test",
    "timeUnix": 1721717032,         // UNIX timestamp in milliseconds, an integer
    "level": "INFO",
    "logMessage": "Custom log message"
}
Key Requirements:
- The full schema definition is available in the CDLS contracts repository
- Overview of all available fields: CDLS Fields Documentation
- When logs get scraped from Kubernetes, other fields visible in Kibana get populated automatically
Upcoming Features: We plan to add the following fields to CDLS, usable for all CAIP teams:
pipeline_namepipeline_steprun_id
Accessing the CDLS Logs
Access Kibana
To access Kibana, one needs to undergo the Data Privacy training listed as "1. Data Privacy Training" as a prerequisite in Access to Kibana. Afterward, they may request access for select hubs and environments up to one year, describing the purpose of the access:
- Rest of the World: Request access here
- China Only: Request access here
Usage
Kibana UI access links are listed in the official documentation. For accessing it in eu-central-1, follow the appropriate link from the access documentation.
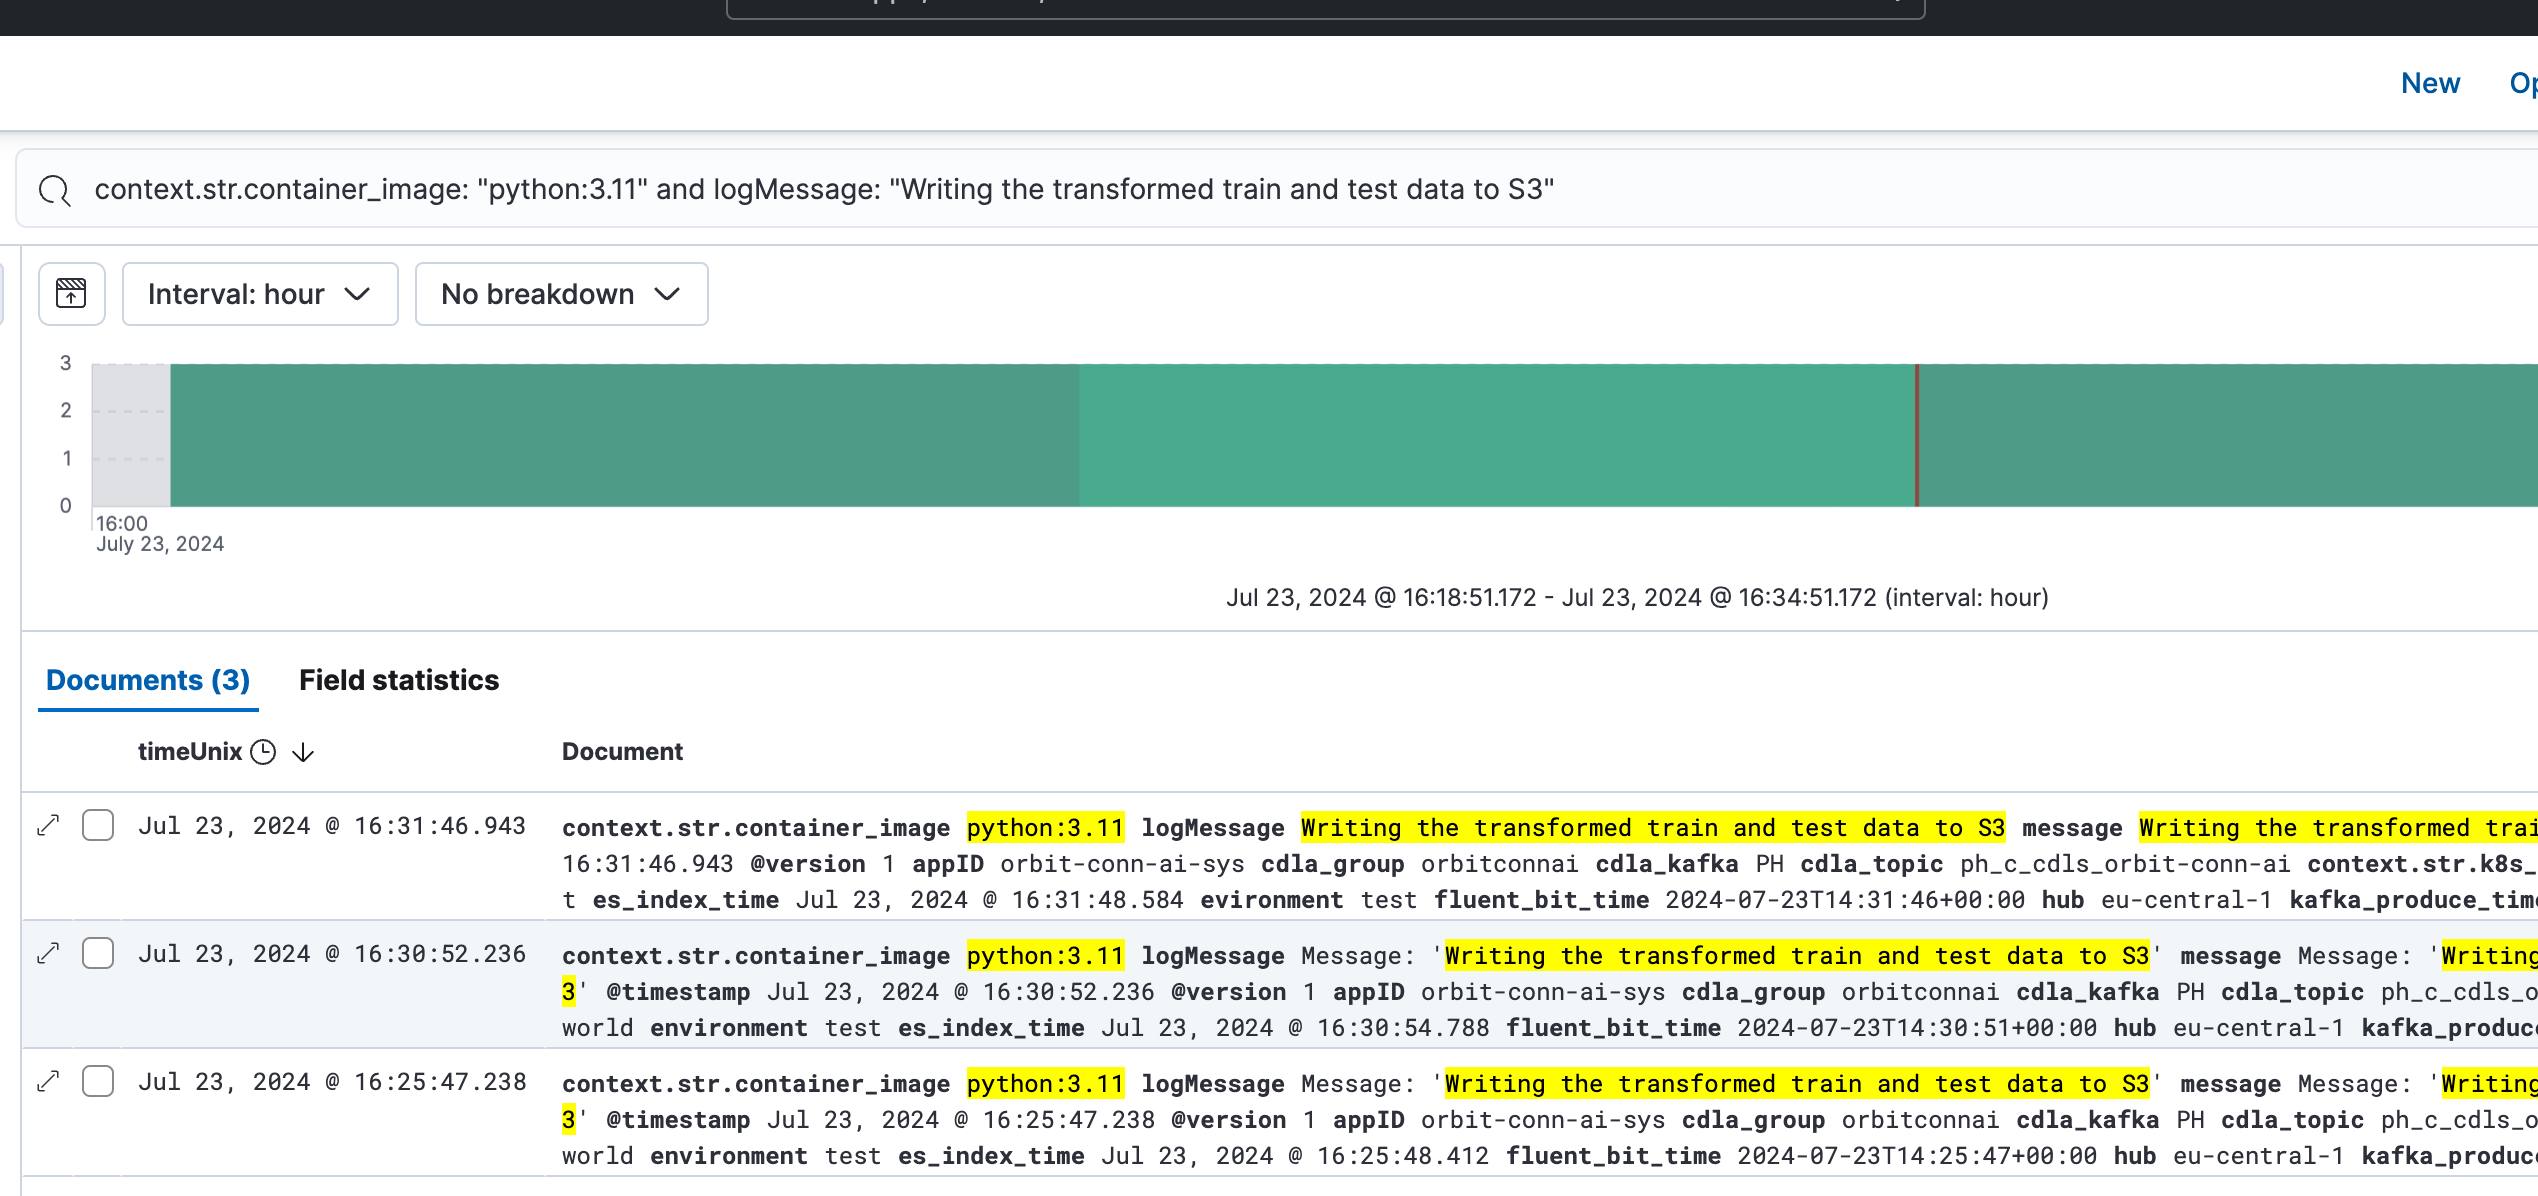
From Kibana, the fields exposed as outlined in the log format section, with extra fields appended by Kubernetes and CDLS, are available for filtering and analysis.
Key Features:
- Centralized log aggregation across all pipeline components
- Real-time log monitoring and alerting capabilities
- Advanced filtering and search functionality
- Integration with BMW's enterprise logging infrastructure
- Compliance with BMW data privacy and security standards