Model Serving
Deploy and serve your trained machine learning models for both batch and real-time inference on the Connected AI Platform.
Overview
Model serving is the process of making your trained models available for inference in production environments. The Connected AI Platform supports two primary serving patterns to meet different use case requirements: batch inference for processing large datasets and live inference for real-time predictions.
Model Serving Types
Batch Inference
Batch Inference refers to making predictions on a large dataset all at once or in batches. This approach can significantly reduce inference time and is ideal for processing historical data or generating predictions for large user bases.
On the Connected AI Platform, you can:
- Load a trained model in a Kubeflow Component step
- Process S3 data in batches for predictions
- Schedule regular batch inference jobs
- Optimize resource usage for large-scale processing
Live Inference
Live Inference, also known as real-time inference, refers to the process of making predictions in real-time as data is fed into a machine learning model. This is essential for applications requiring immediate responses.
On the Connected AI Platform, you can:
- Expose your model as a RESTful endpoint
- Enable real-time prediction consumption
- Scale automatically based on request volume
- Monitor inference performance and latency
For live inference, we provide KServe, which includes:
- Model deployment capabilities
- User-friendly UI and navigation
- Real-time inference endpoints
- Comprehensive metrics and logging
Deploying a Model
⚠️ Attention: The below steps serve as a guide on what Kubernetes cluster resources should get applied to deploy a model. Our example pipeline illustrates these steps in a Pythonic way.
Training a Demo Model
You can run below code to generate a demo model, and then you can upload 'model.joblib' to S3.
from sklearn import svm
from sklearn import datasets
from joblib import dump

iris = datasets.load_iris()
X, y = iris.data, iris.target

clf = svm.SVC(gamma='scale')
clf.fit(X, y)

dump(clf, 'model.joblib')
Deploying Models via Available Serving Runtimes
You can directly bring your model and serve the model using the available Model Serving Runtimes. To perform that, click on the "+ NEW Endpoint" button in "Endpoint" tab.
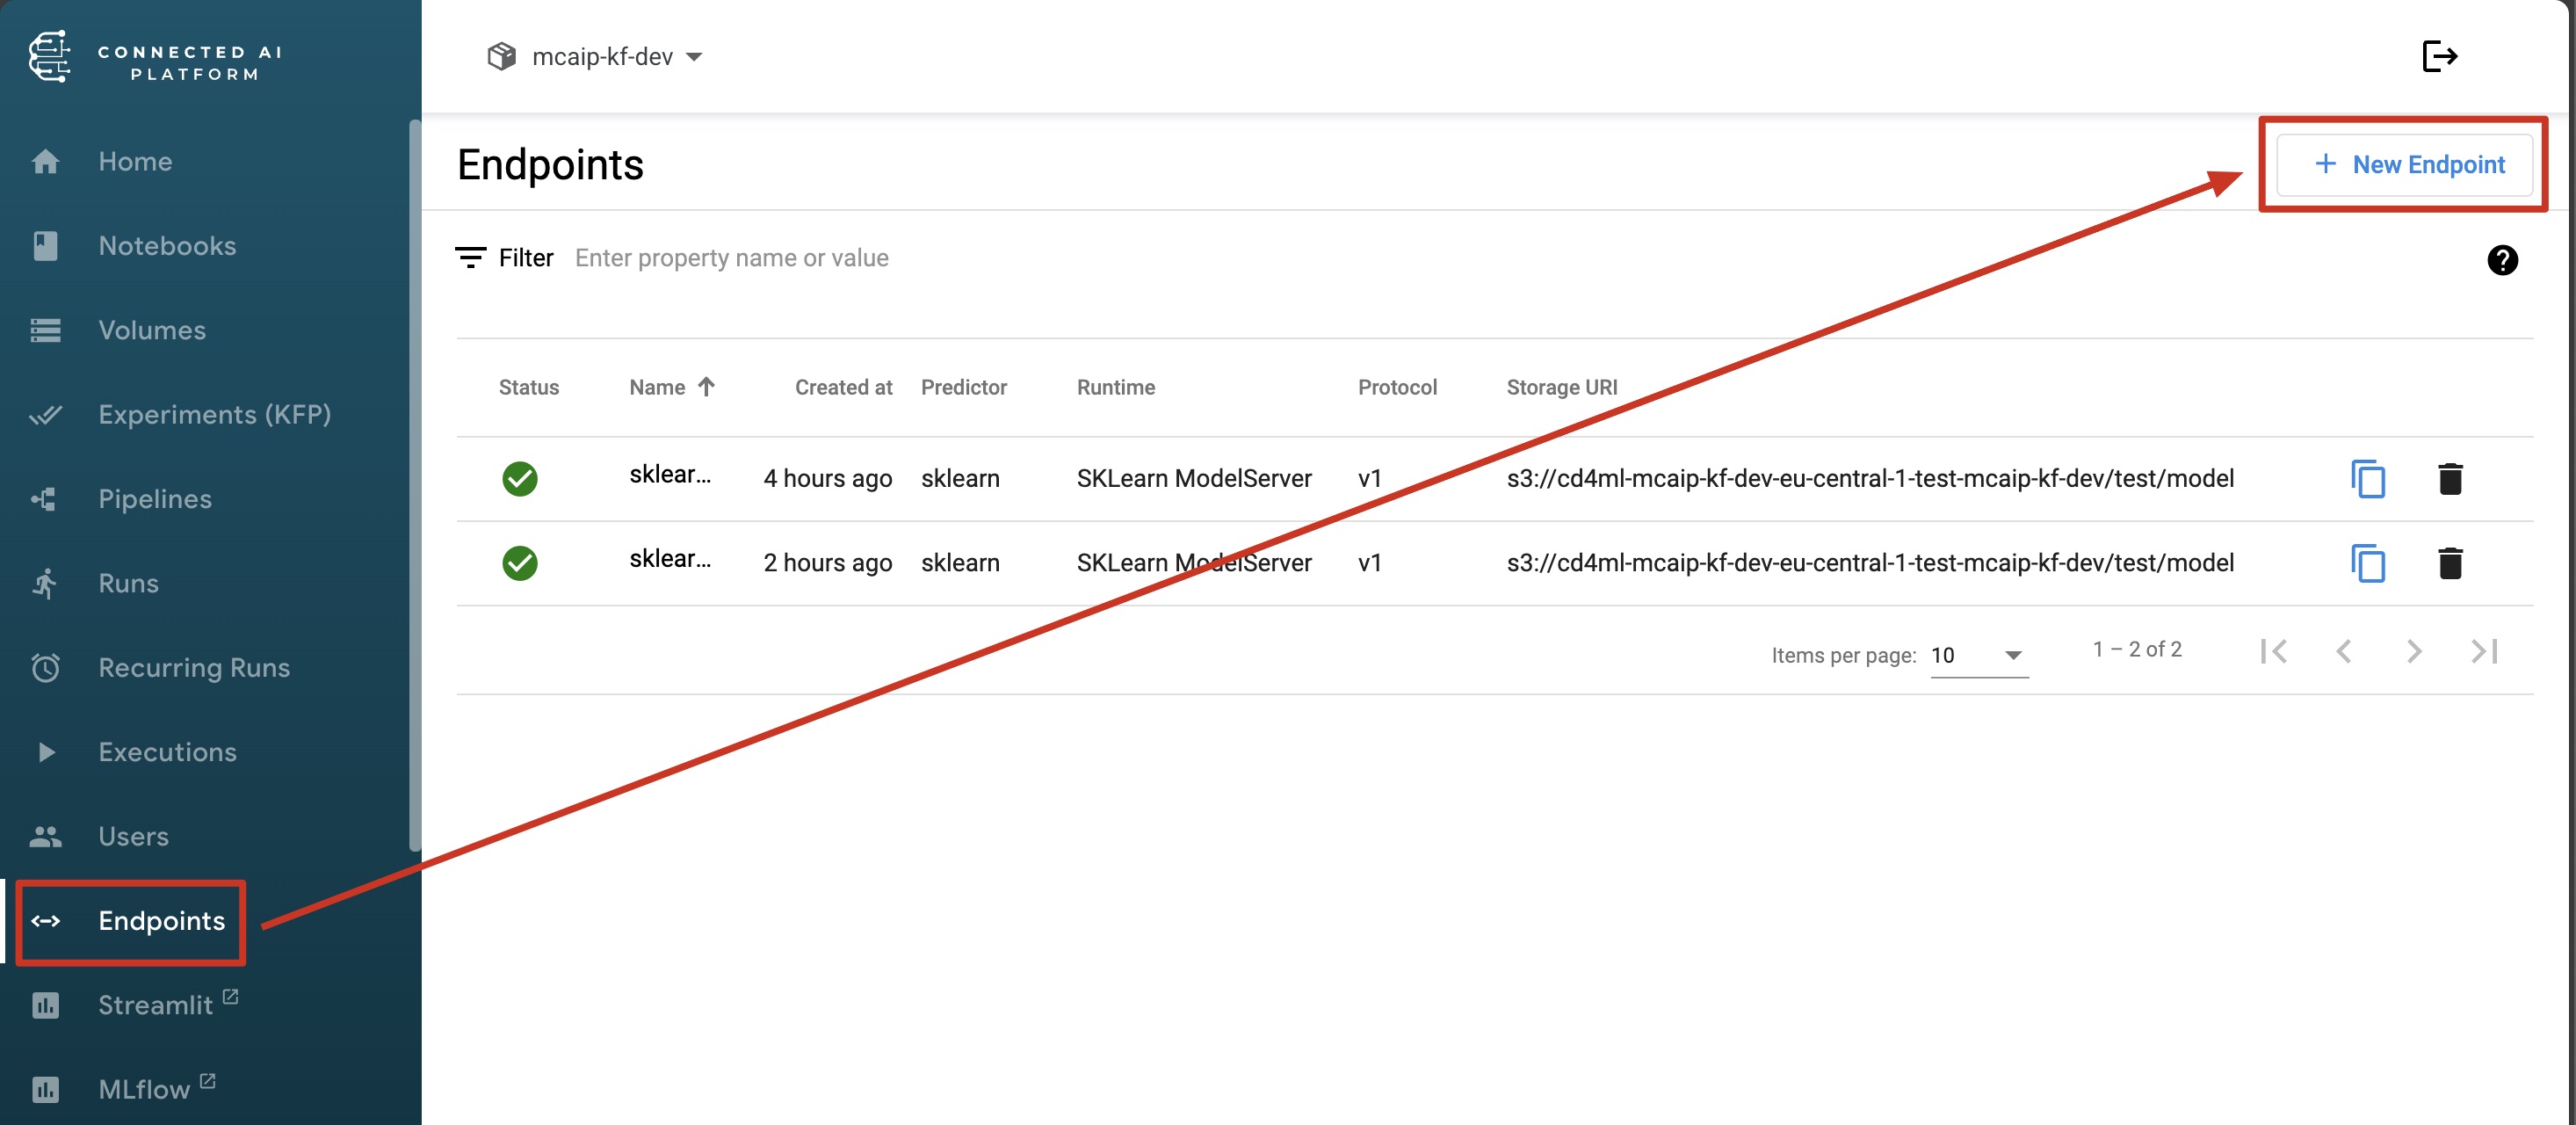
It should open a pop up where you can paste the YAML to an inference service similar to the one below:
inferenceservice.yml
apiVersion: "serving.kserve.io/v1beta1"
kind: "InferenceService"
metadata:
  name: "sklearn-iris"
spec:
  predictor:
    serviceAccountName: default-editor
    model:
      modelFormat:
        name: sklearn
      storageUri: "s3://<YOUR-MODEL-STORAGE-LOCATION-IN-S3>"
The modelFormat name should be one of the available model serving runtimes.
KServe - UI and Navigation
KServe is a standard Model Inference Platform on Kubernetes, built for highly scalable use cases. It is a native Kubernetes solution for hosting your models and works seamlessly with Kubeflow which powers the Connected AI Platform.
KServe on the Connected AI Platform
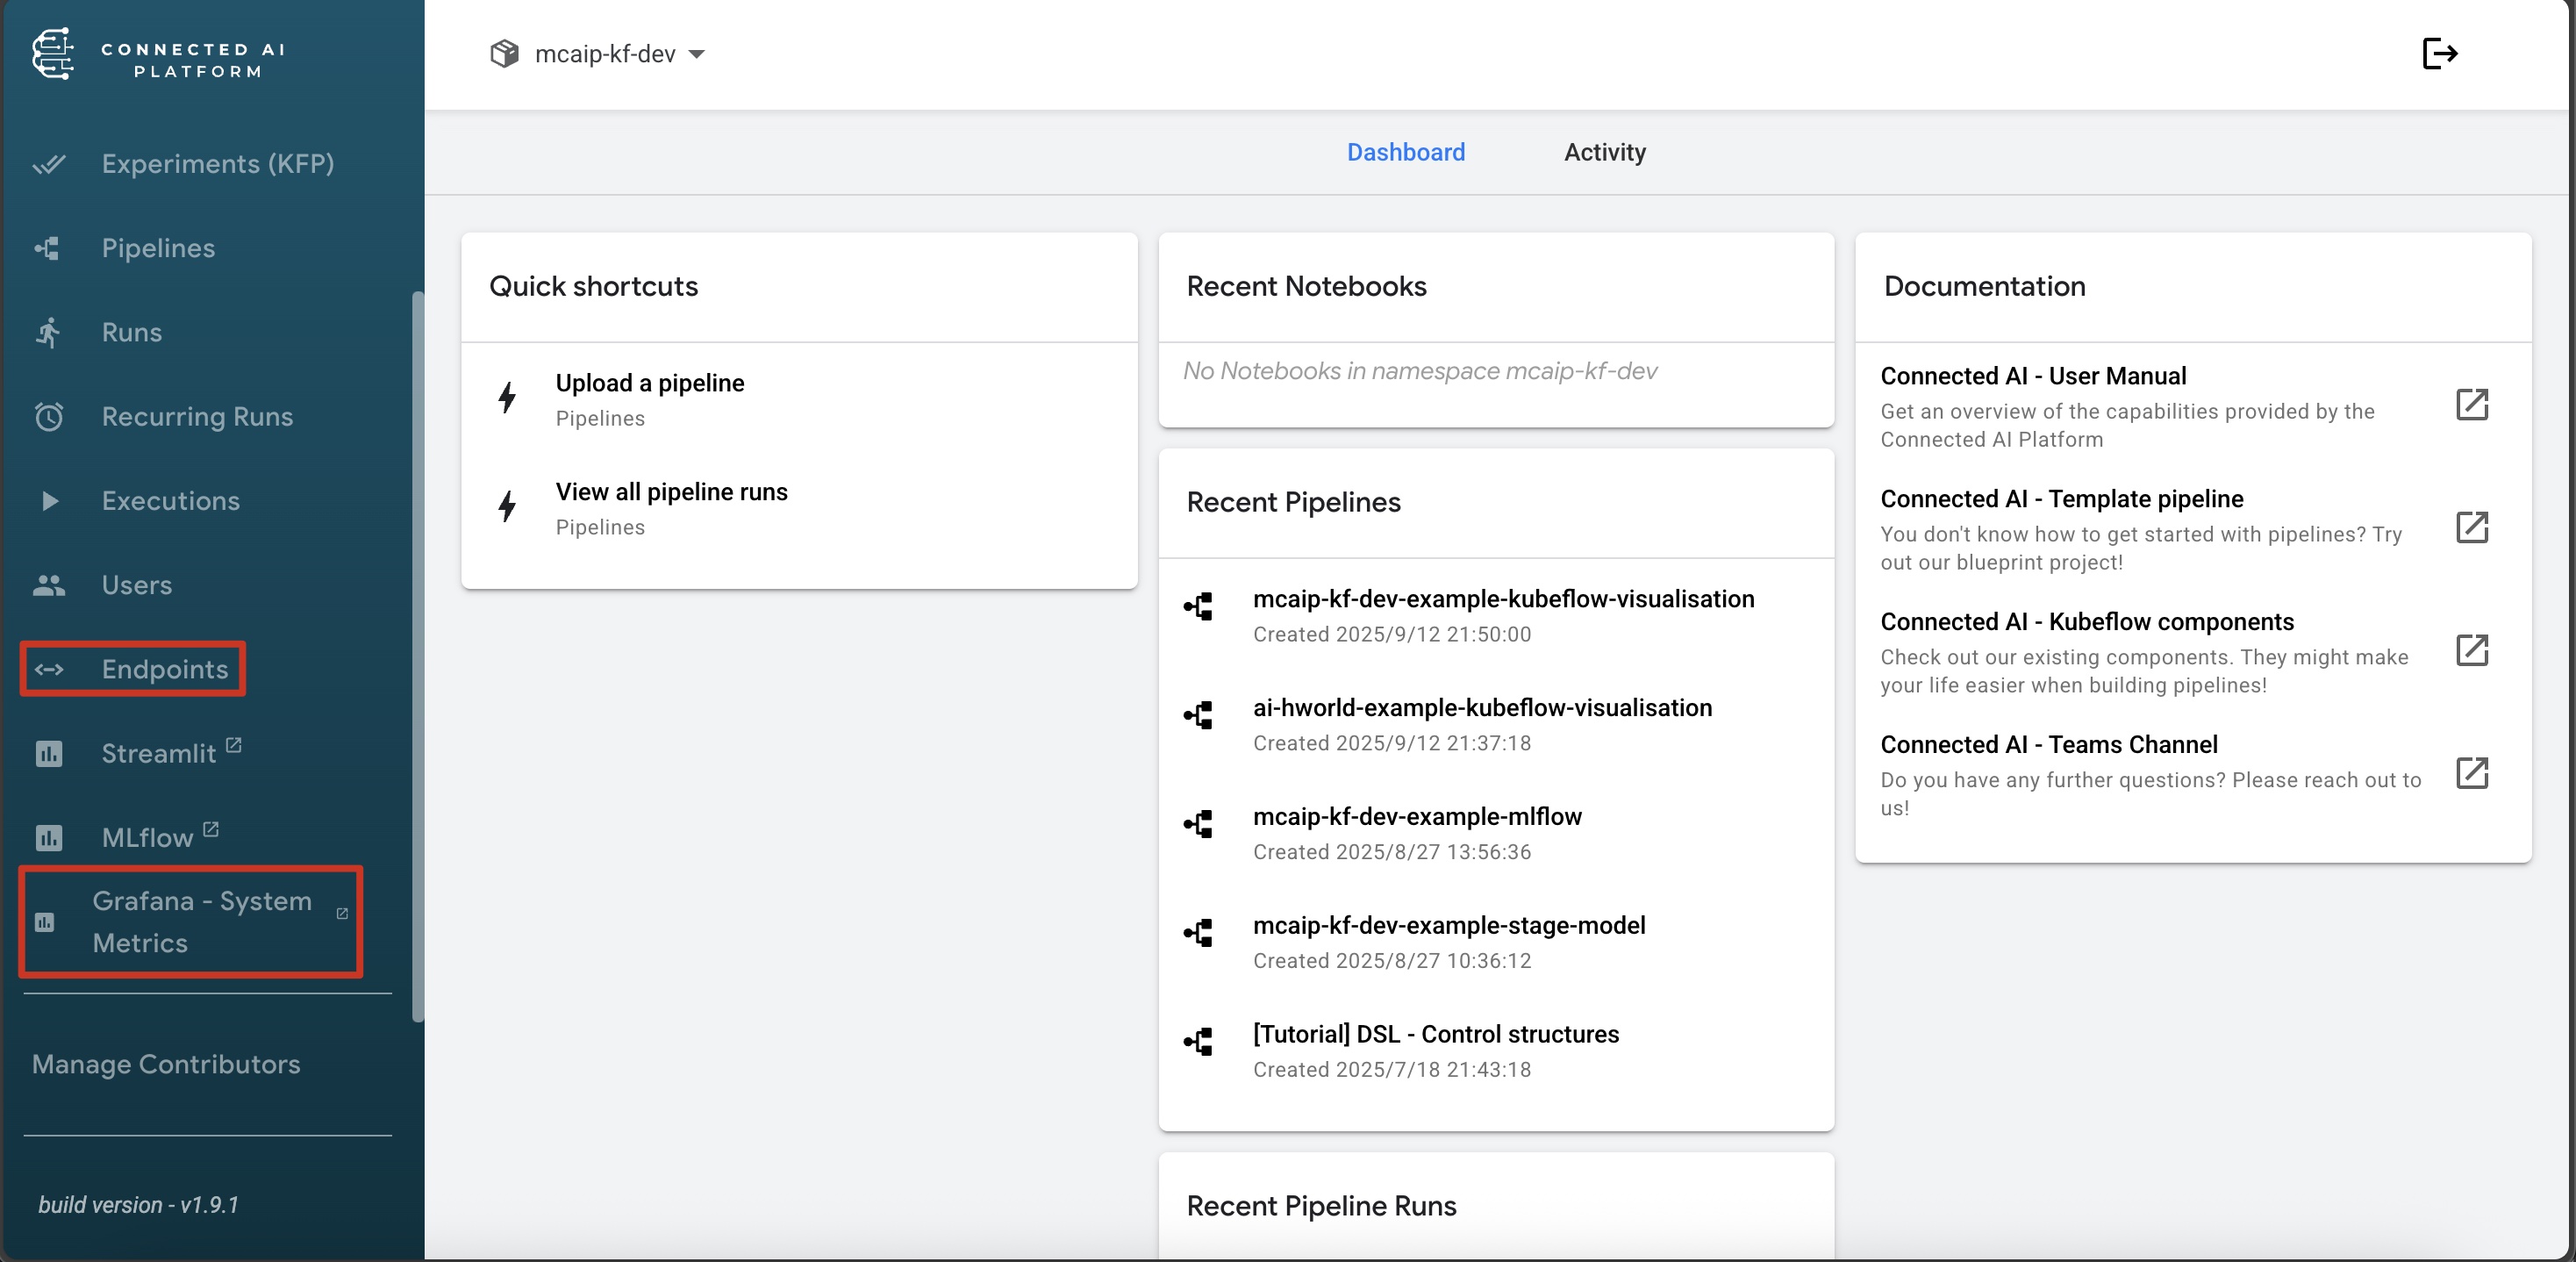
You have most likely seen the sidebar when visiting the Connected AI Platform UI. In this document you would get more information regarding the highlighted entries in the image which can be seen on the left side. The last 2 elements on that image correspond to:
- Endpoints UI: Shows information regarding the models deployed via KServe
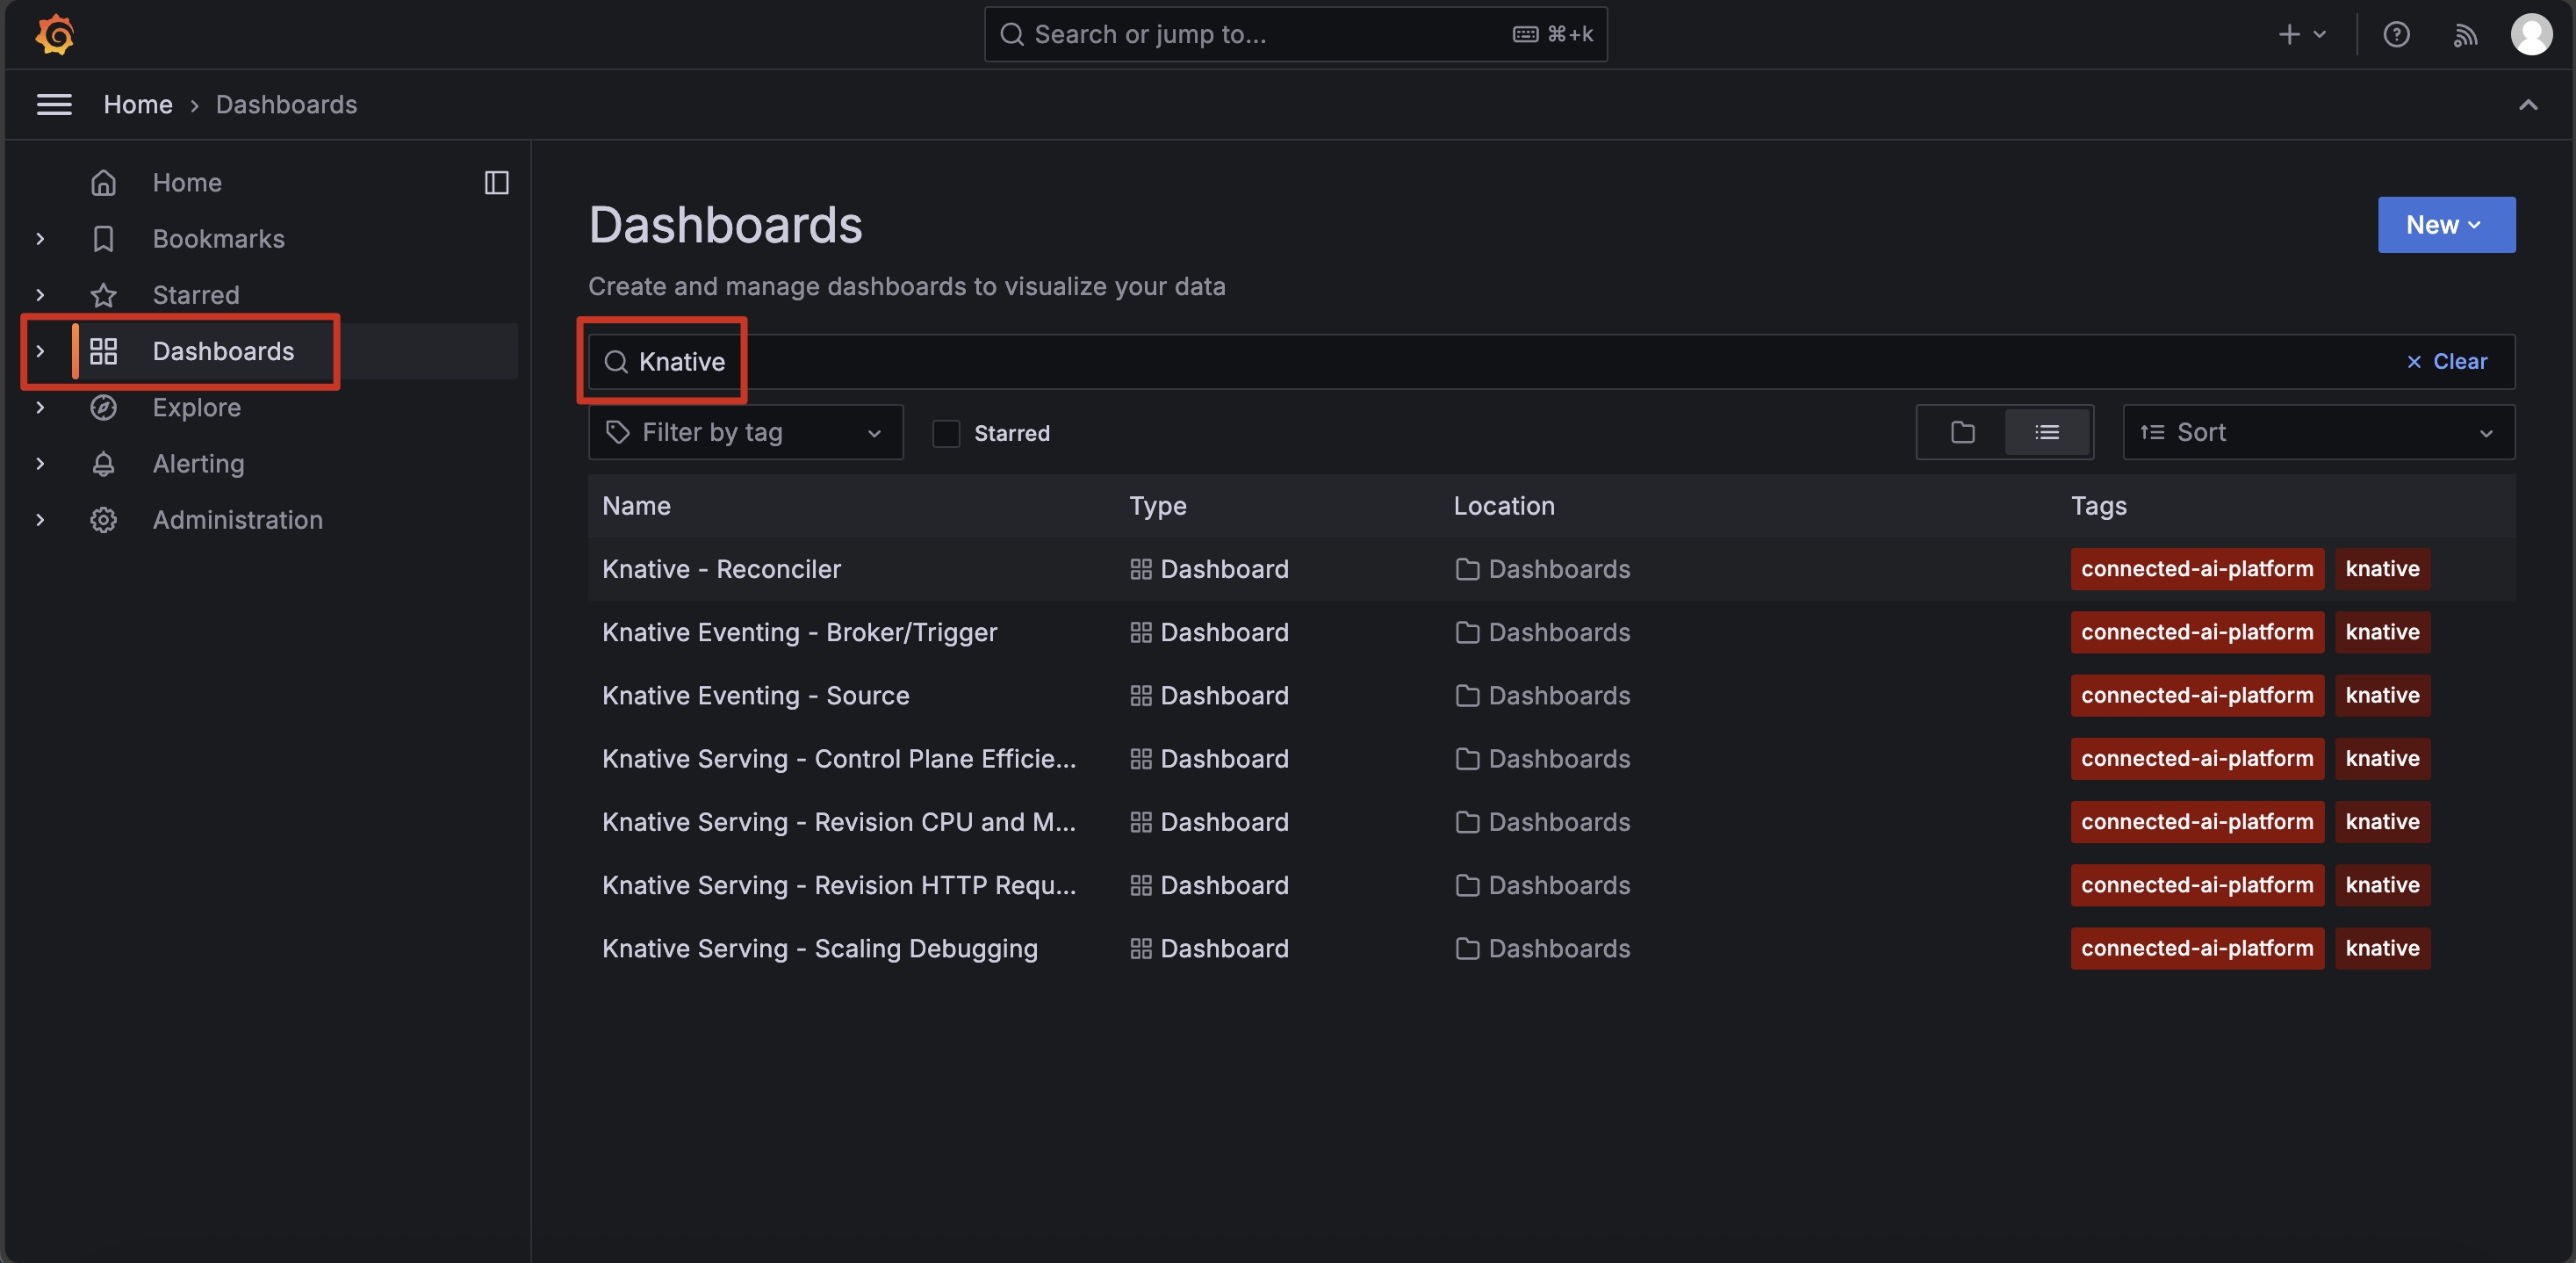
- Grafana UI: Redirects to your own Grafana instance, where you can filter on particular dashboards related to served Models (using Knative filter)
Endpoints
Clicking on the Endpoints on sidebar brings on a page which lists all the available models (which are currently being hosted), with basic information regarding the predictor framework, runtime, protocol version and the location where the model is stored in S3. Users can choose to delete the models from this UI as well.
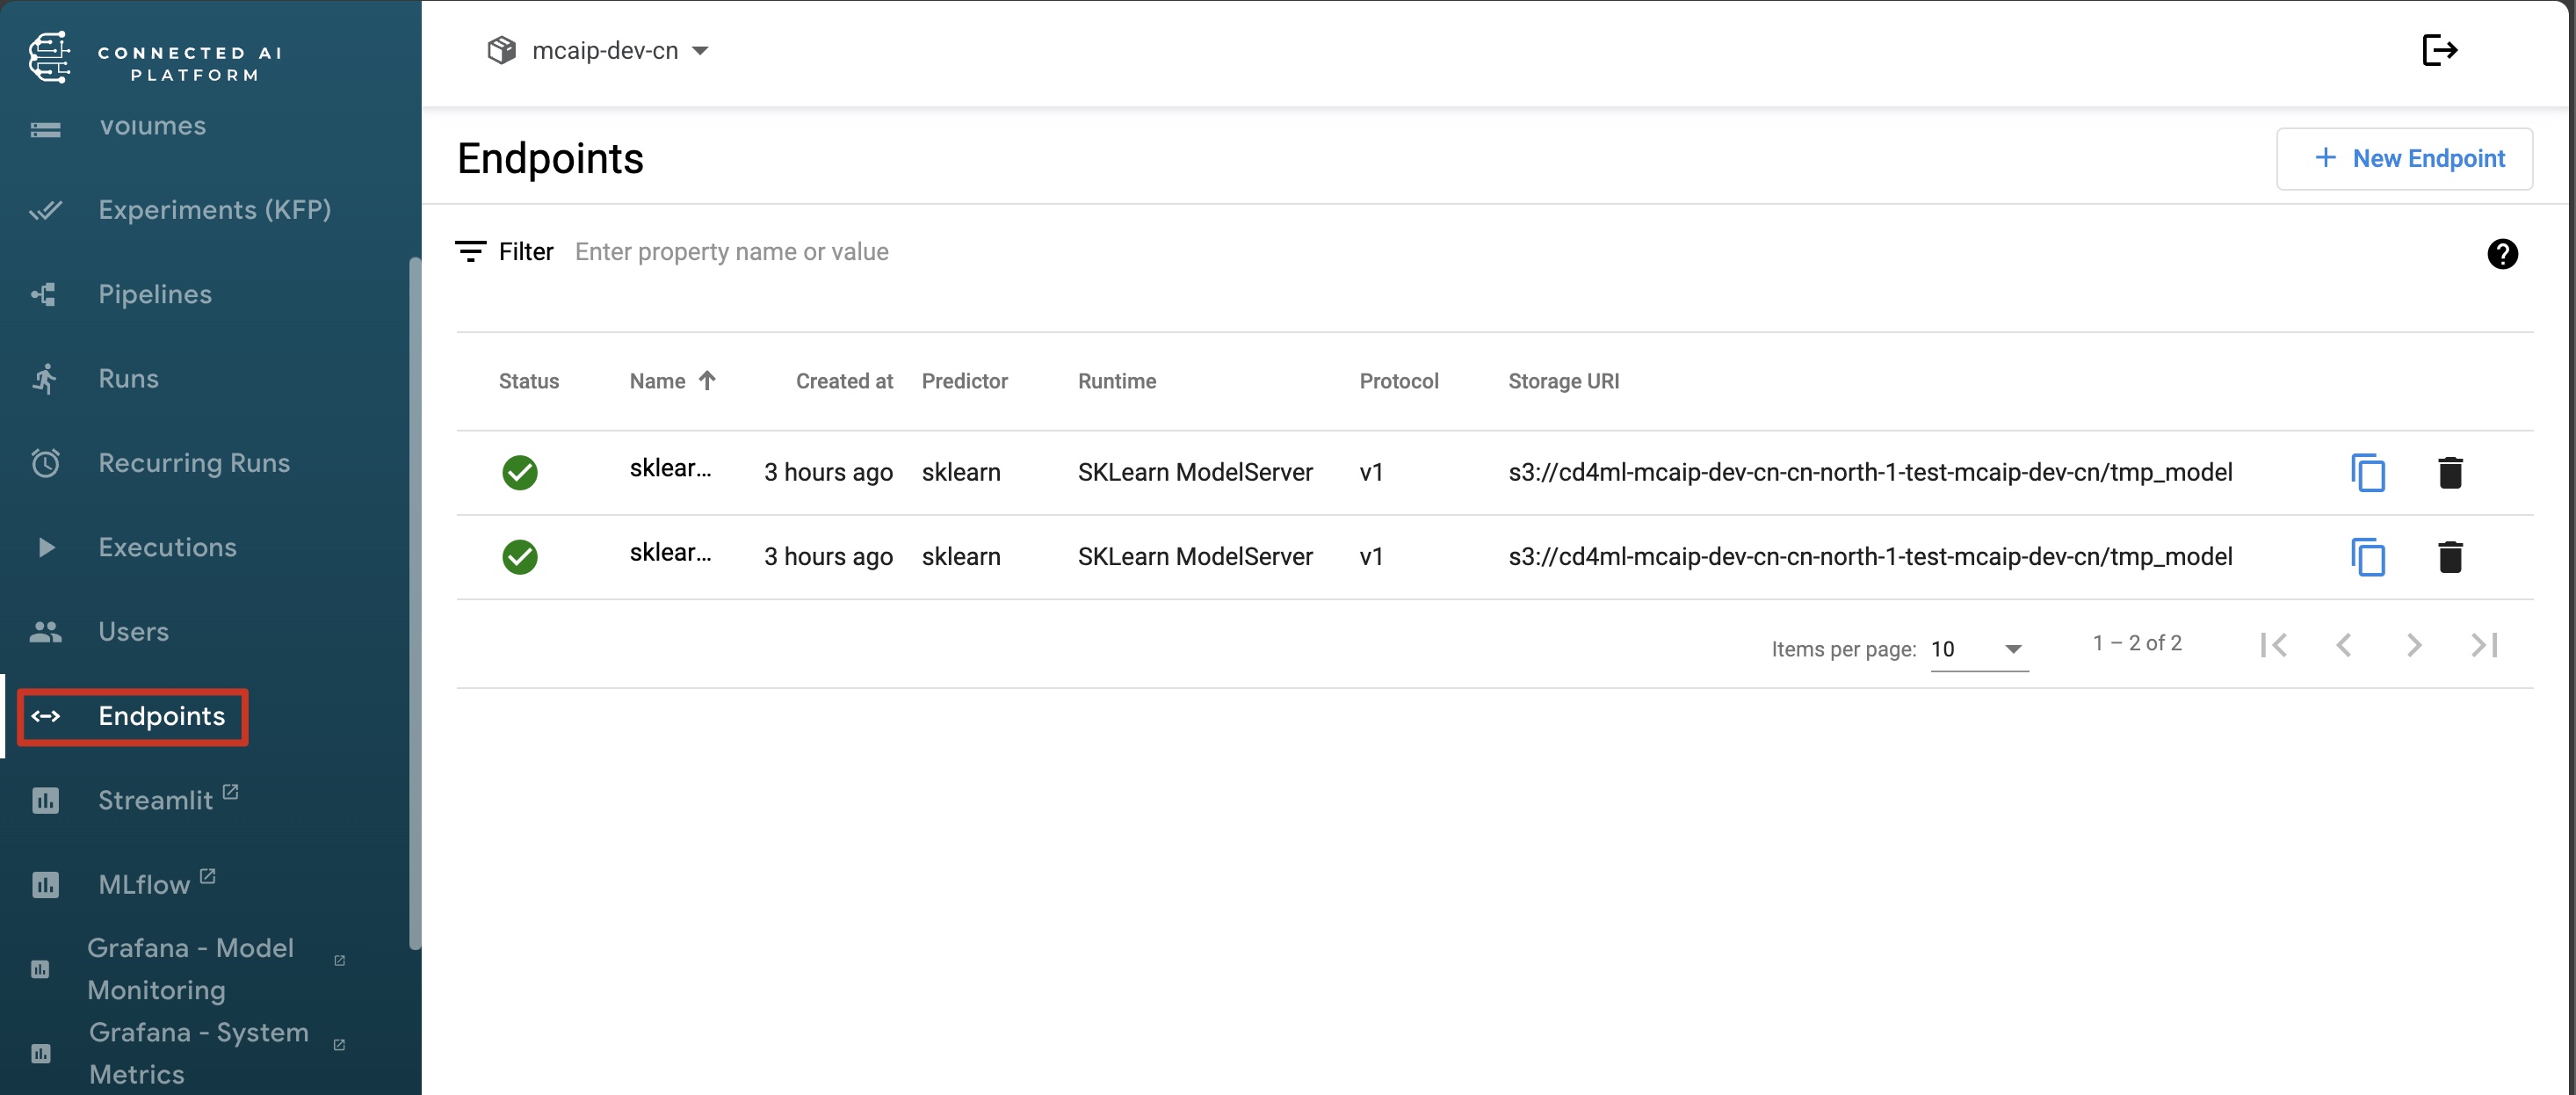
Find more information about InferenceServices and how KServe works can be found in the KServe documentation.
Model Overview
To get more information for the deployed model, users can click the name of the model from the Model Server Page and they would be presented with the Model Overview page similar to the following image:
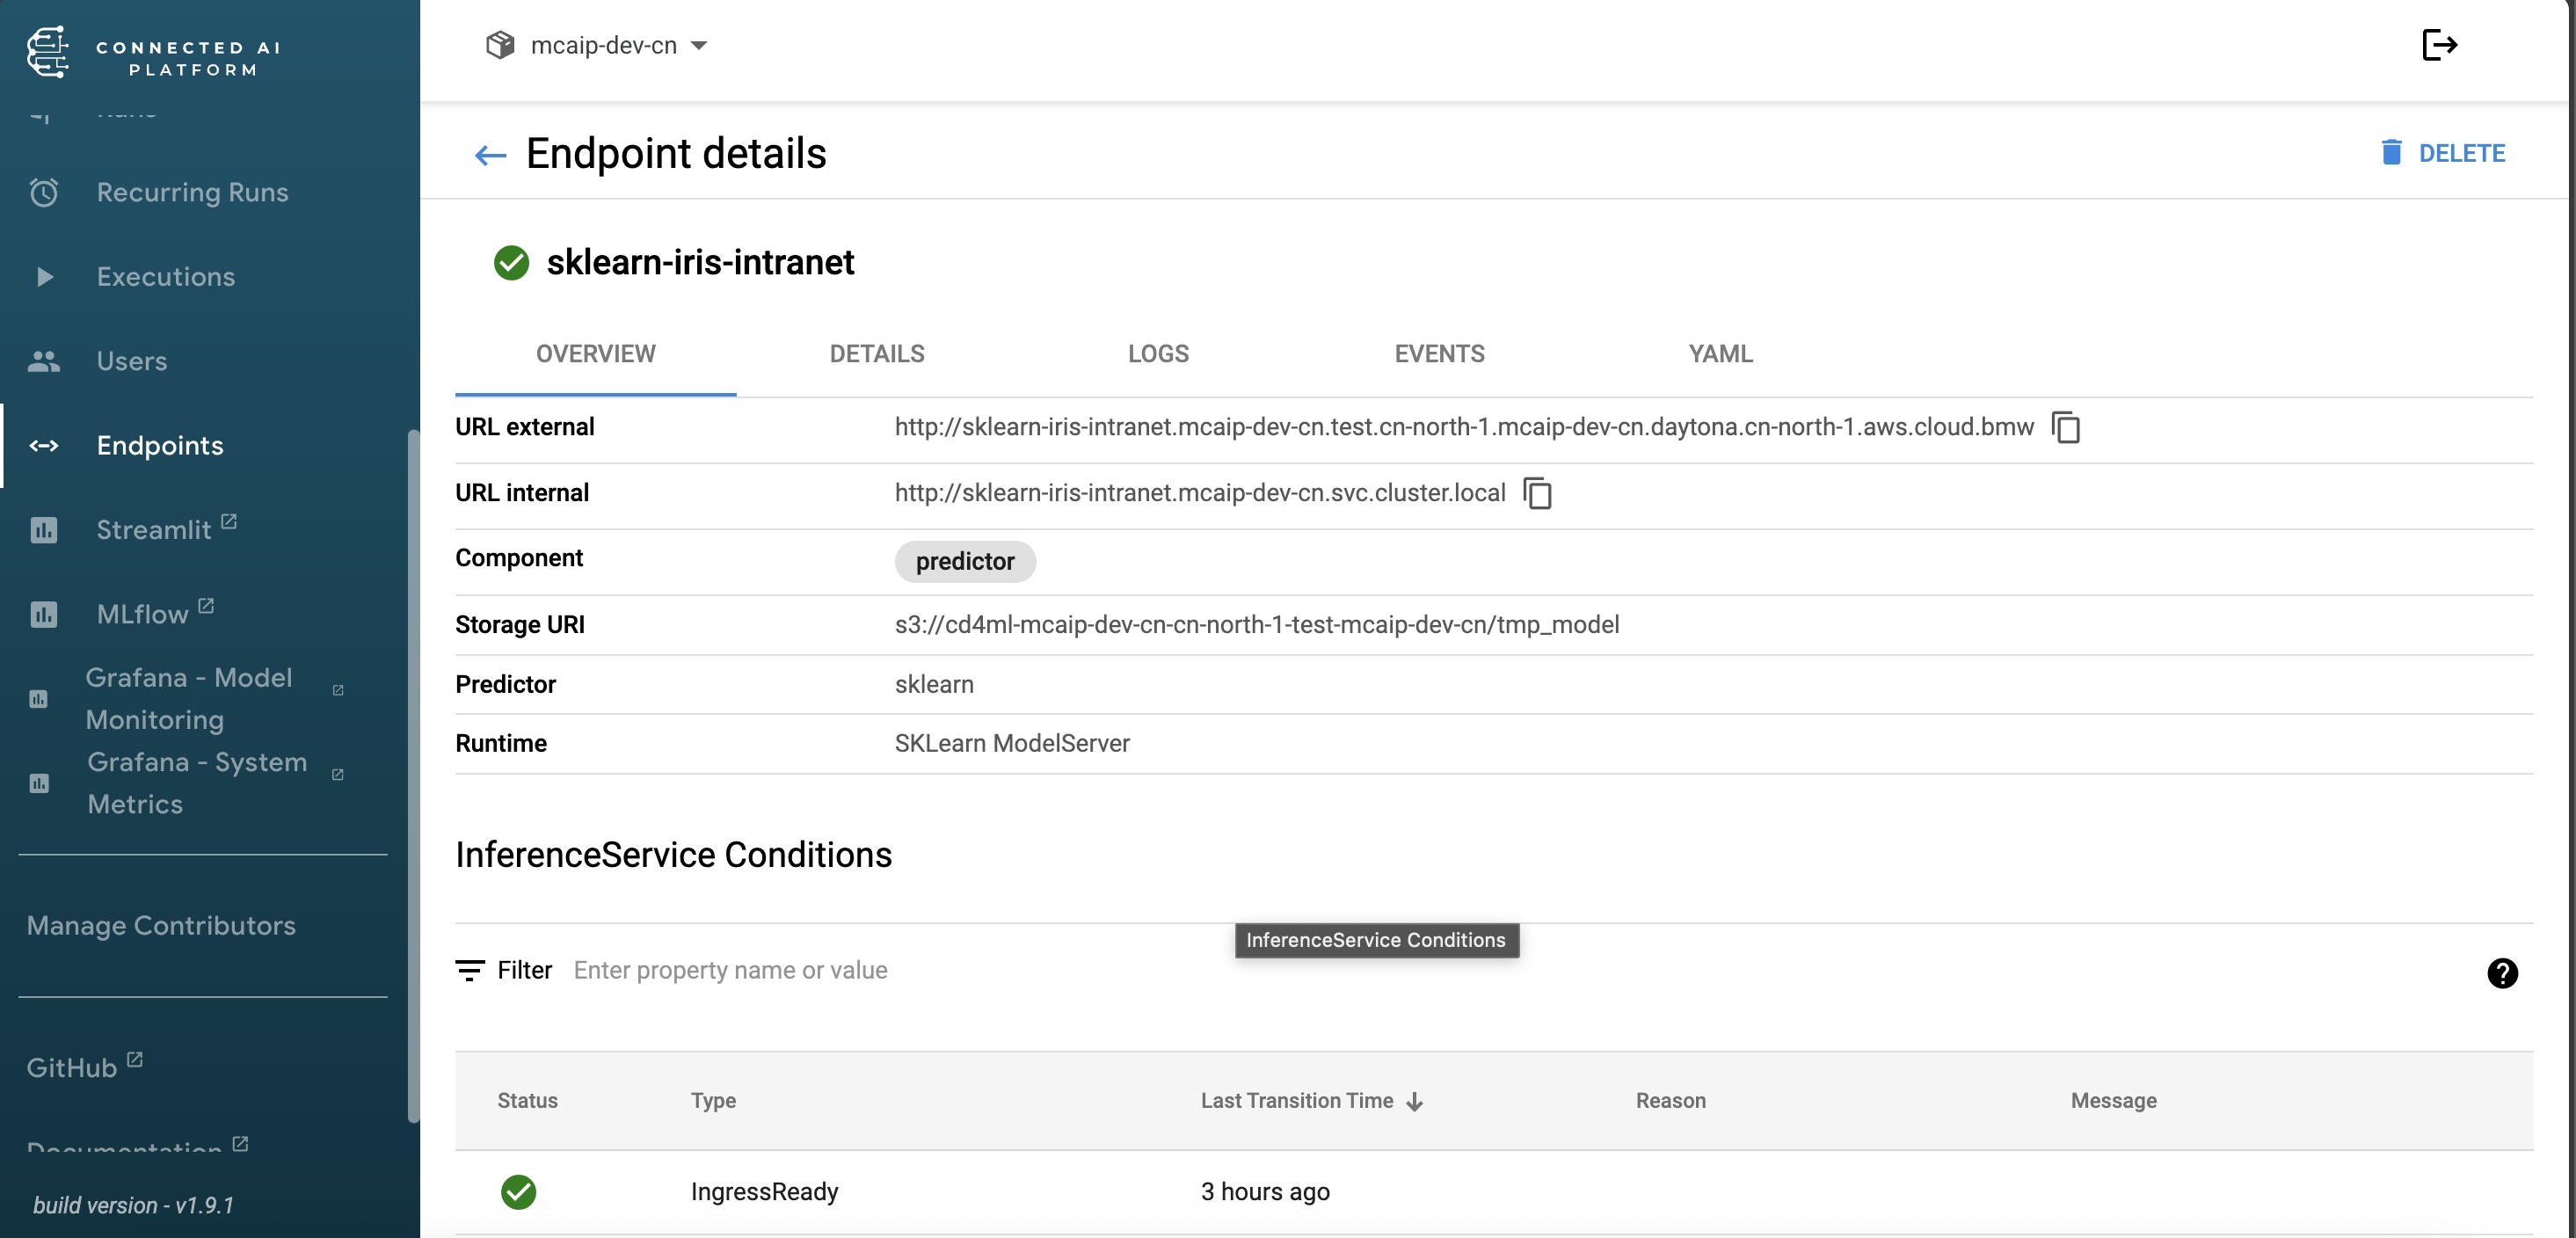
As can be seen, this gives way more information regarding the models including the URL via which the hosted models can be reached.k
💡 Please note: URL external does not mean that the model is available from the internet. The external URL can be of 2 types - one where models are exposed over the "BMW intranet" as is shown above and the other one where models are exposed over the "Internet" (contact the platform team for internet exposure configuration).
Model Details
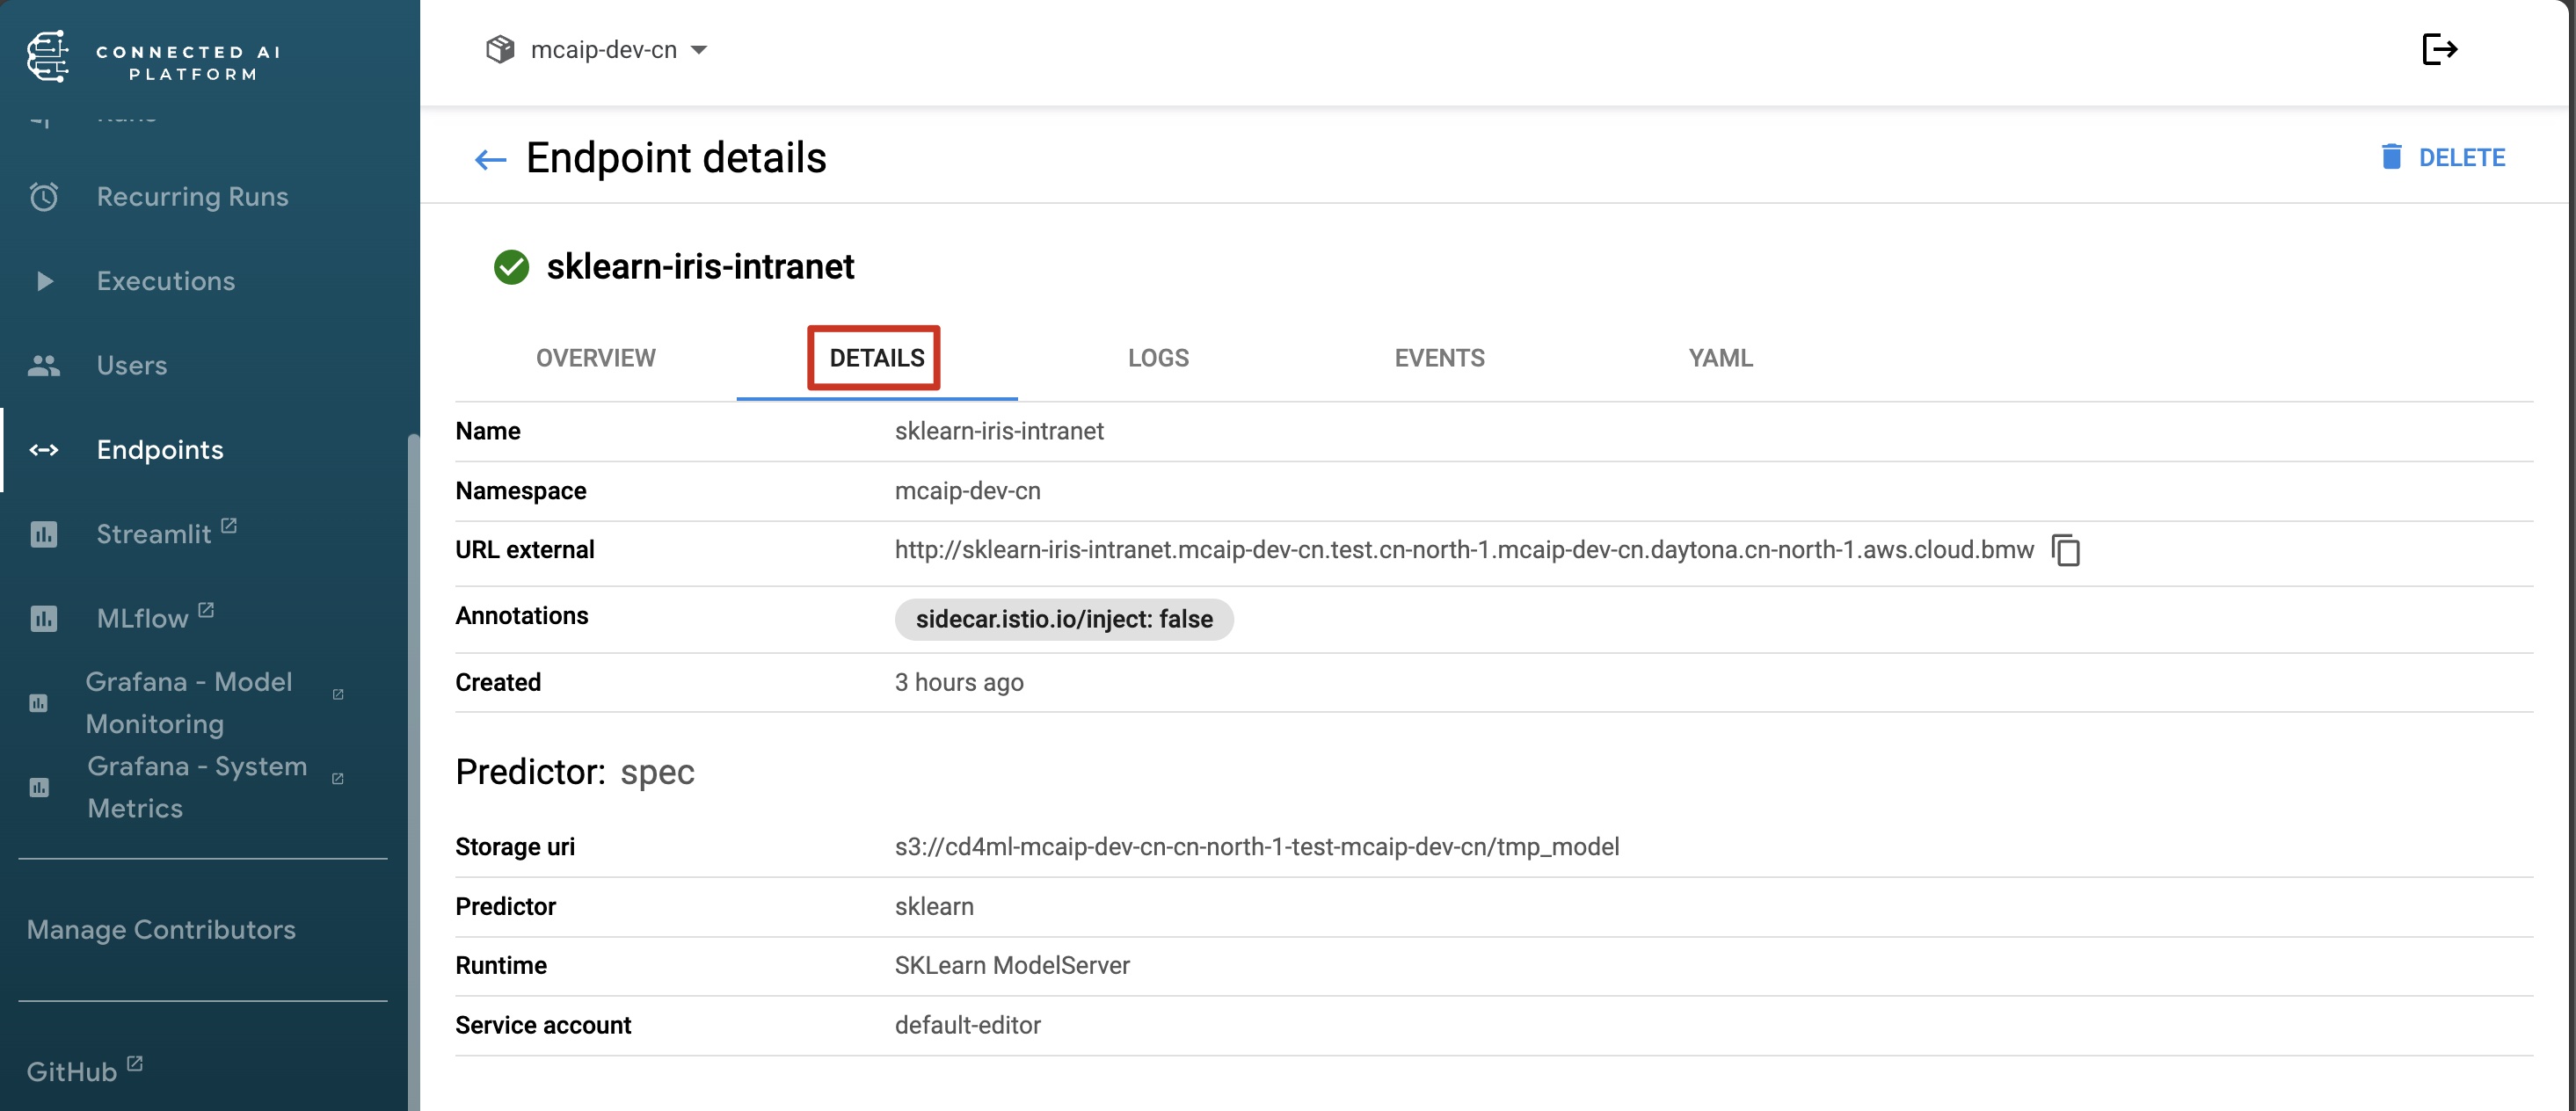
The model details page provides more details regarding the model, the resources it is using, and also whether the model consists a predictor only or predictor and transformer both.
- Predictor: Only the model is served, the requester is responsible for performing transformations and feature engineering in the format the model expects.
Model Logs
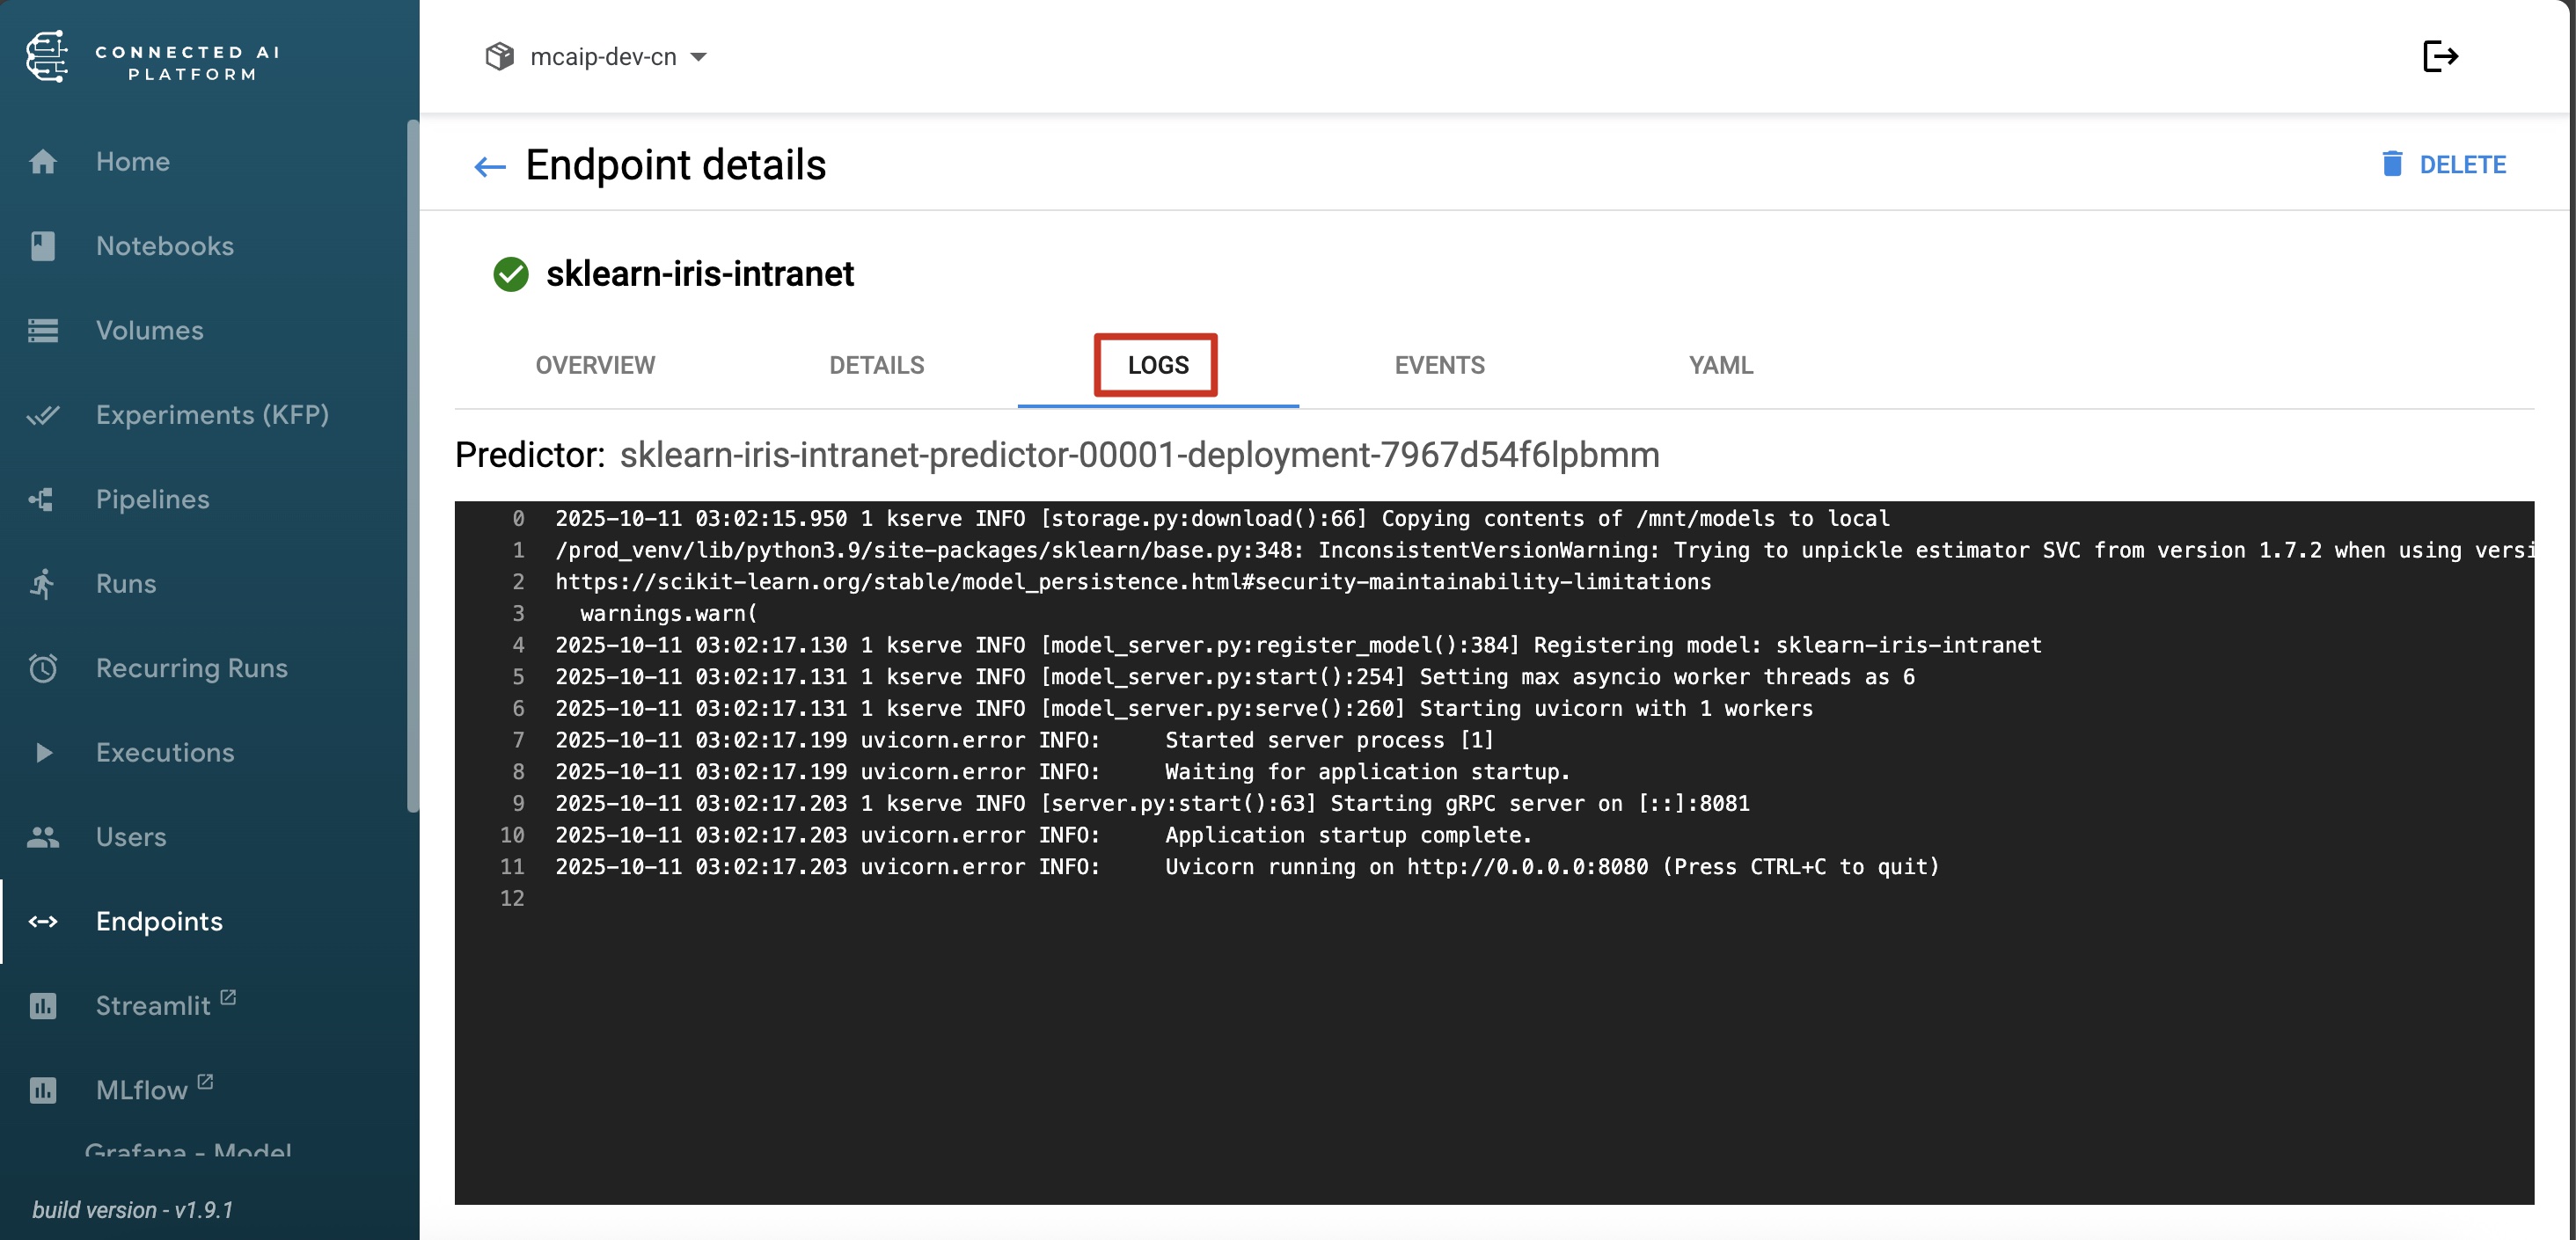
The model logs tab shows the logs from both the predictor and transformer in real time. Any logging related to the requests made to the model would be shown here.
Exposing Model & Inference
There are two regions in CAIP Platform, RoW and CN. Different region use different fqdn, please pay attention when exposing.
- RoW: Rest of World, except China
- CN: China
You can choose expose a model to Intranet ot Internet. These two approaches differ when deploying the InferenceService. Please refer to the example below.
- Intranet: BMW Intranet
- Internet: Public Internet
💡 Please note: You must set
sidecar.istio.io/inject: "false"in InferenceService annotation when you want to expose a model.
💡 Please note: Only RoW supports exposing to Intranet, CN not yet.
Intranet
Use the Traefik-based KServe guide for intranet exposure. Your InferenceService must include the inferenceType: traefik-intranet label.
Serve and Expose Guide: Intranet access
After the service is exposed, send requests to the Traefik host from your deployed InferenceService.
Internet(Must with Authentication)
Use the Traefik-based KServe guide for public internet exposure. Your InferenceService must include the inferenceType: traefik-internet label and public access must be protected with authentication.
Serve and Expose Guide: Public internet access
After the service is exposed, send requests to the Traefik host from your deployed InferenceService.
Access (System) Metrics & Model Logs
System Metrics on Grafana
Model Metrics
Clicking on the model metrics icon redirects the user to the Grafana URL in the form https://grafana.<env>.<product>.hub.orbit.<region>.<fqdn>/. The user is presented with the following UI after logging in:
Model CPU and Memory Usage
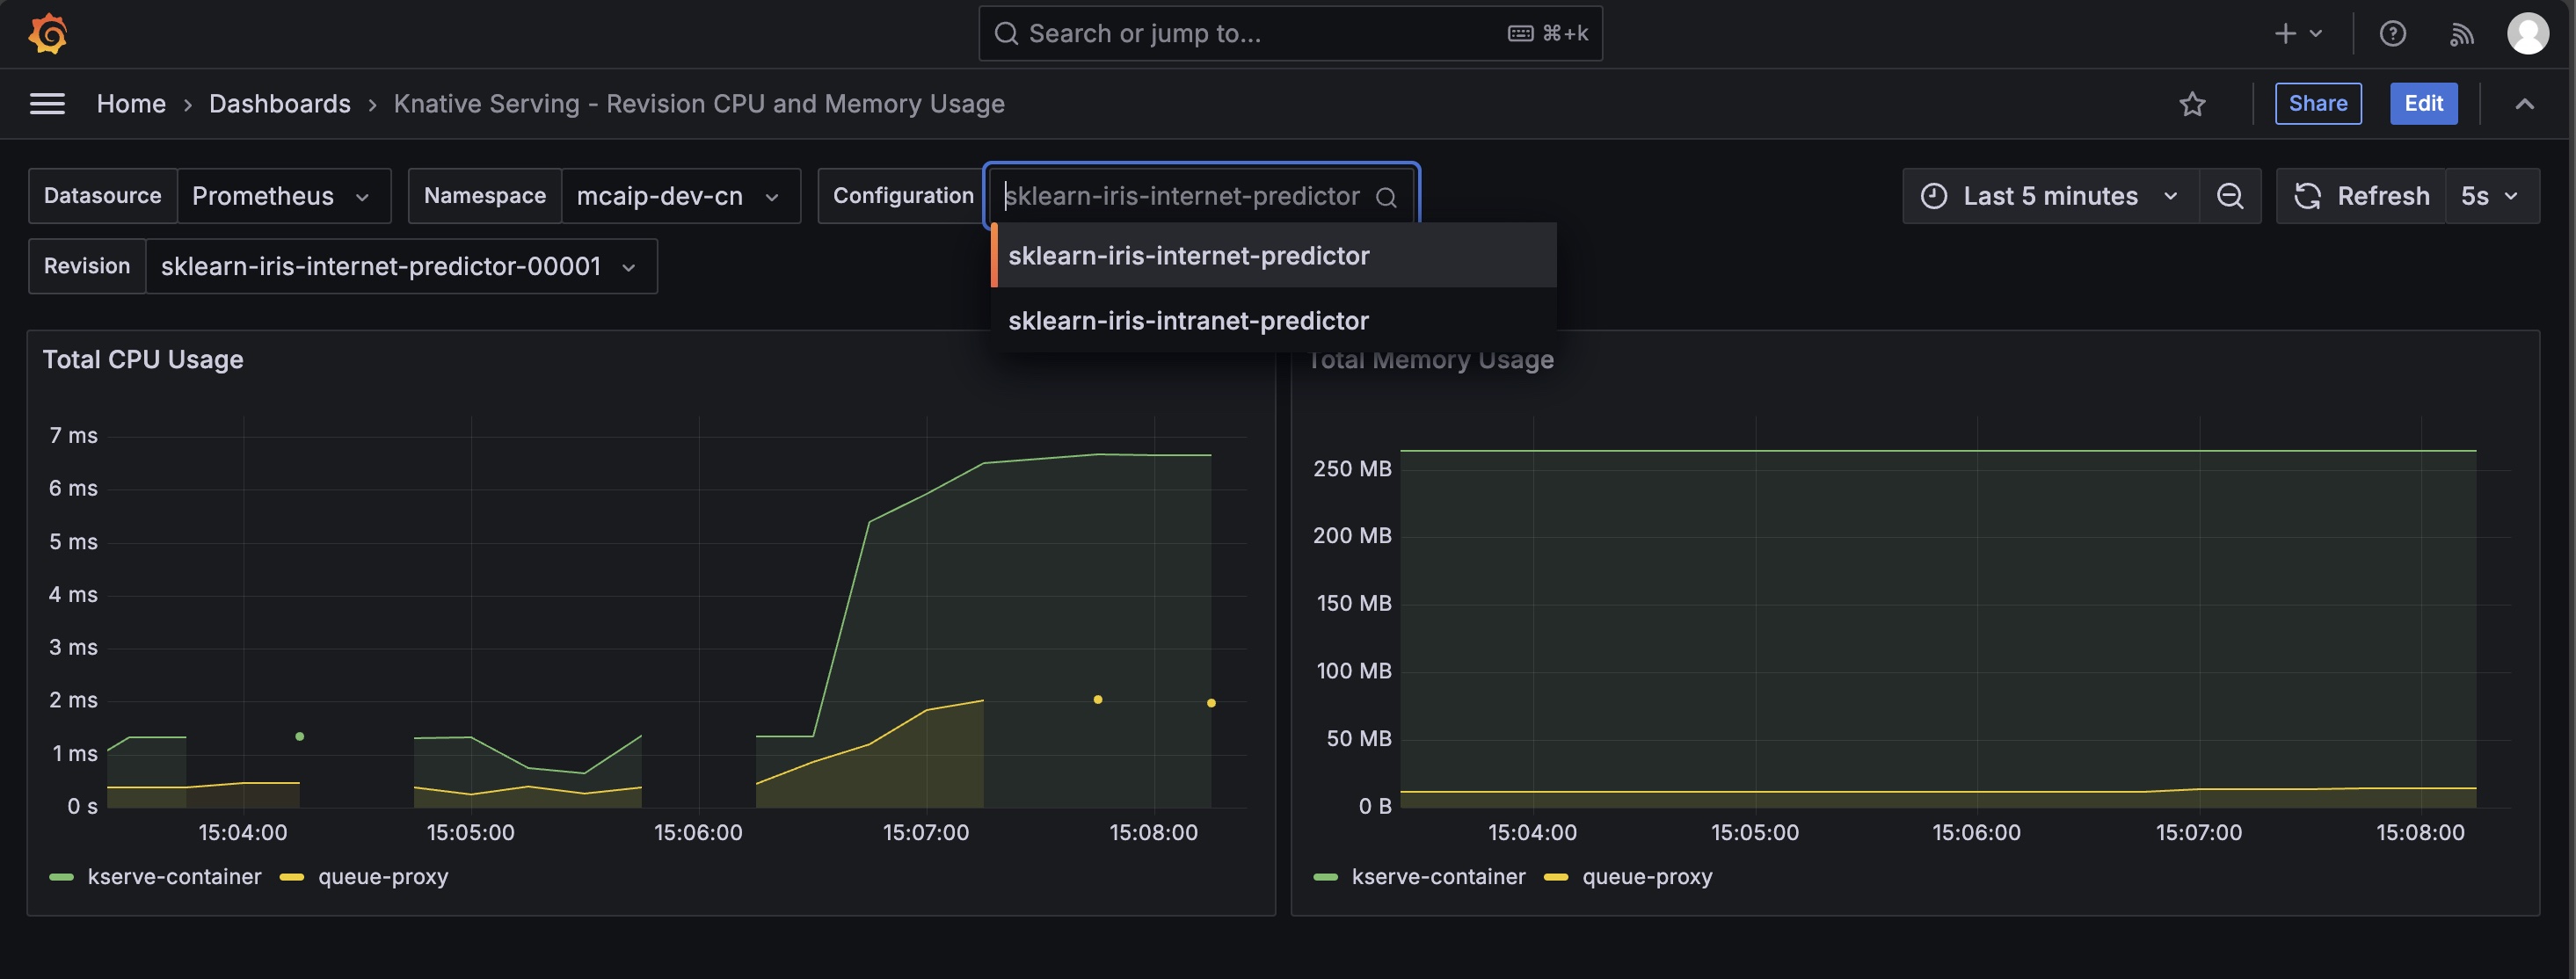
To check Model (Predictor) and Transformer CPU and Memory Usage, users can click on Knative Serving - Revision CPU and Memory Usage, and they would be presented with a screen below. As same dashboards are available for all users with all filters, users would have to select the correct Namespace (this is the same as the profile) and select the model predictor or transformer from the Configuration option. At the same time, the most recent version of the model would be selected in the Revisions section, you can select any other previous deployed version and check its statistics by selecting it for Revision.
Model Requests
To check how many requests your model receives, you can click on the Knative Serving - Revision HTTP Requests link and just like the Model CPU and Memory Usage, you would have to select and filter on the Namespace (profile), Configuration (Model Predictor or Model Transformer).
The Revision would by default select All and thus you would see the requests across all the versions of the model. This is specially useful when you may have canary deployment and thus want to see overall performance, but if you want to select individual versions you can select it under the Revision tab.
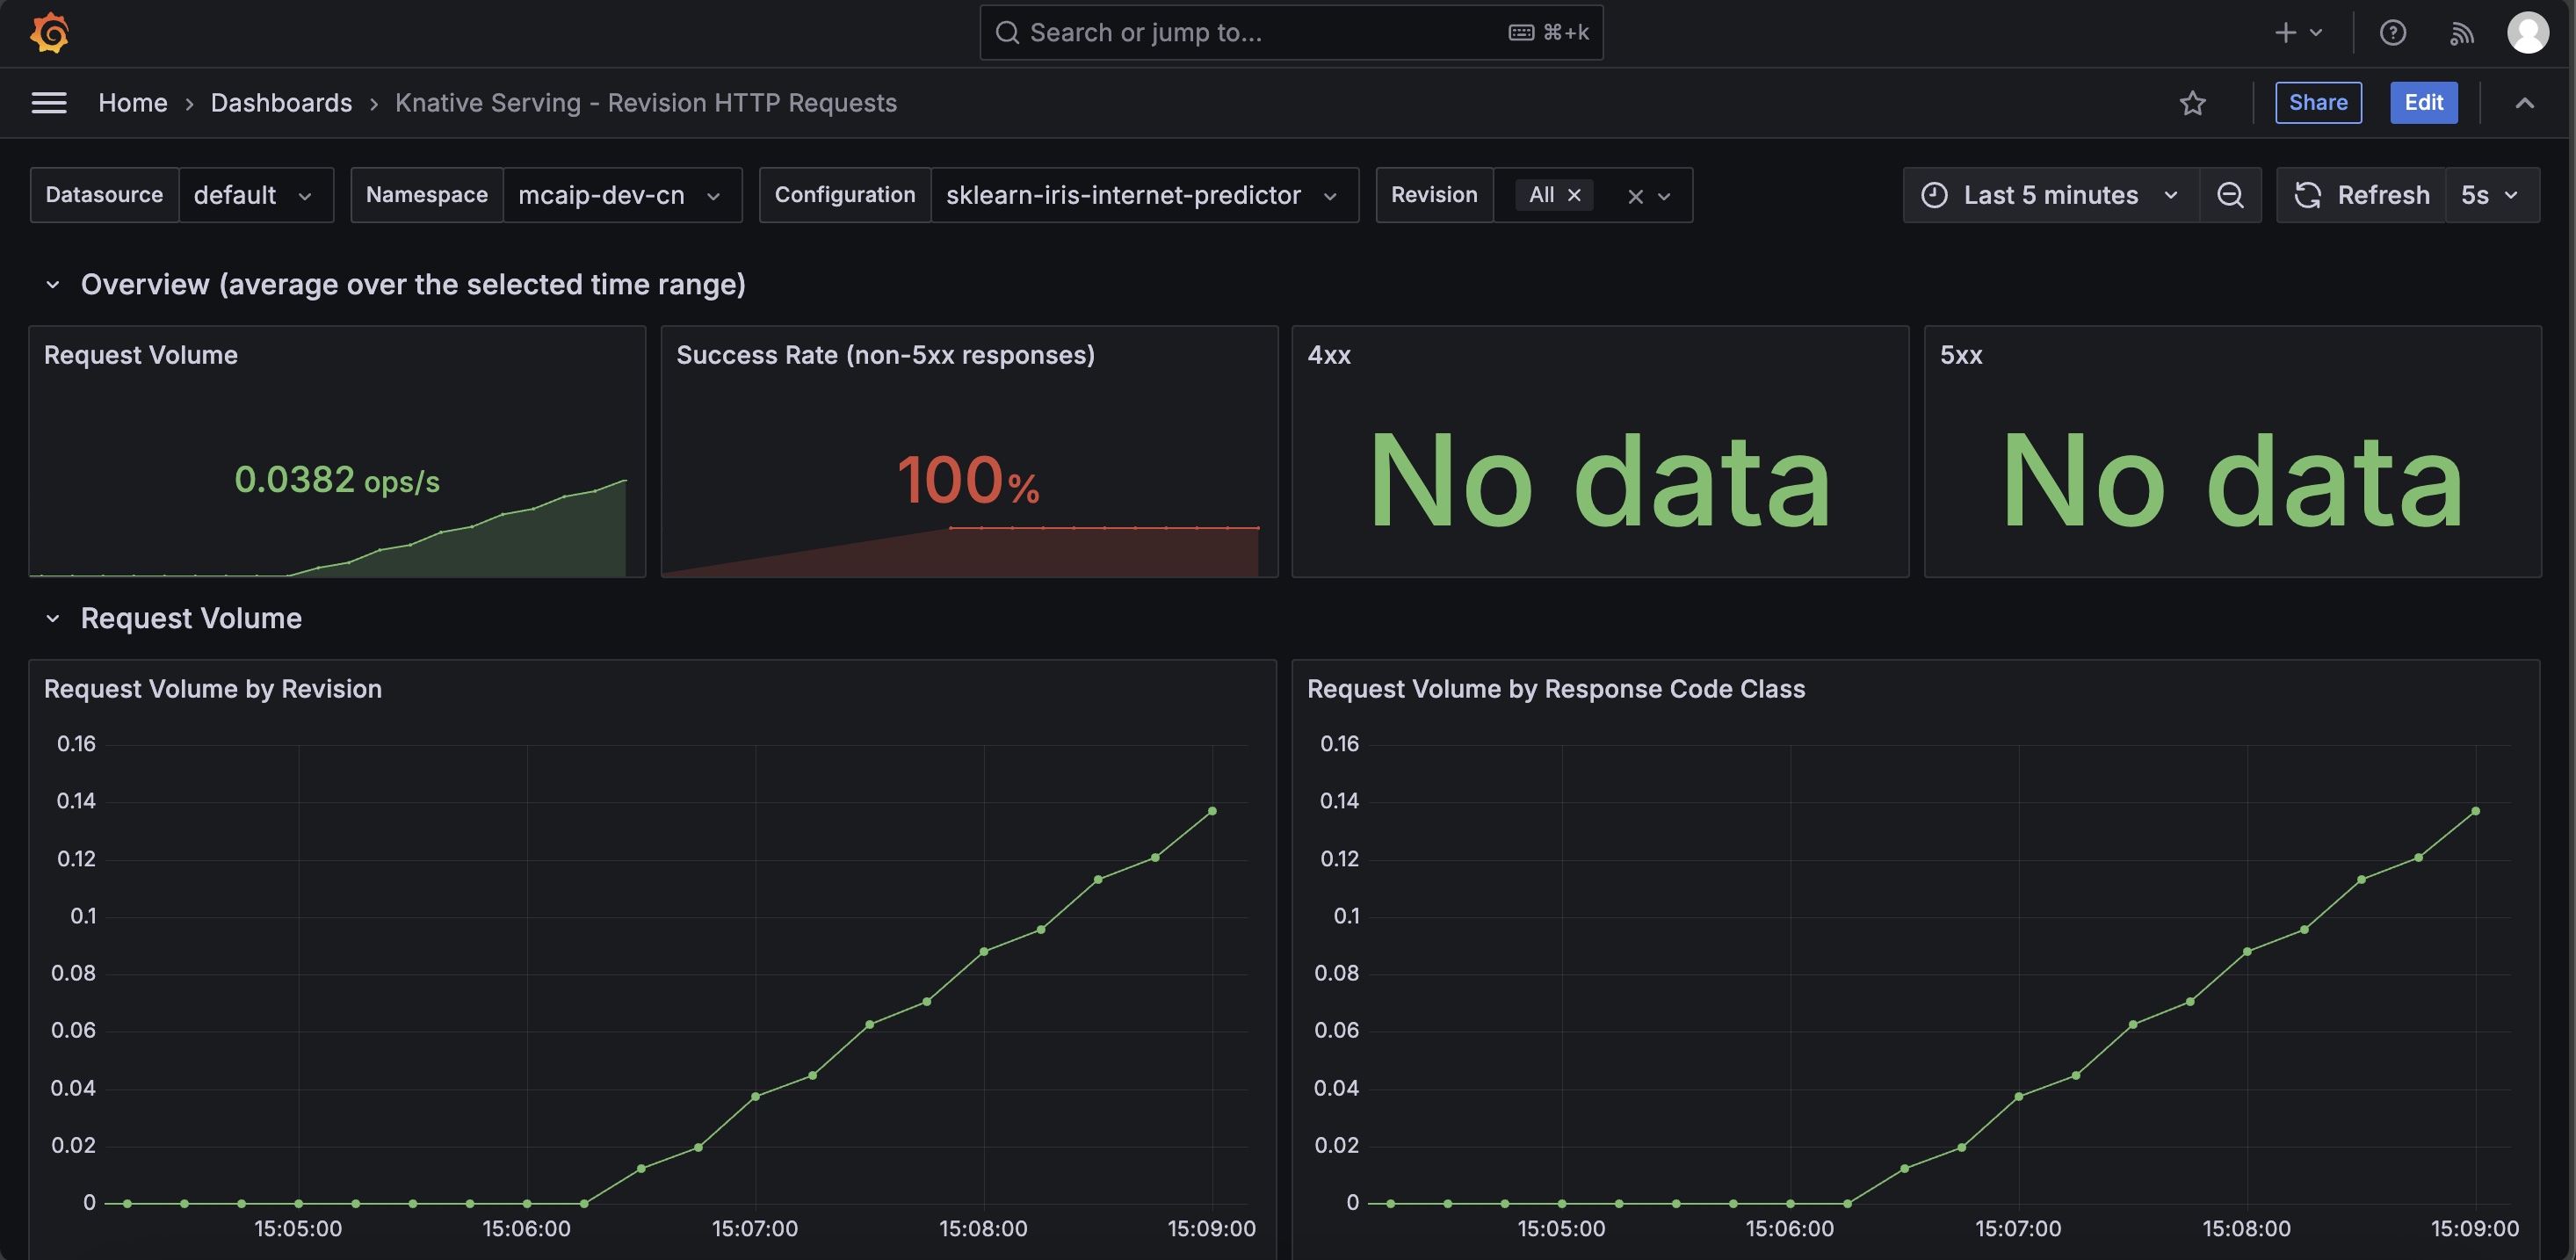
In the example above you can also see:
- The volume of requests per model revision (version)
- Response time of each request per model revision (model)
- The volume of requests per status code class
- The response time per status code class
This gives insights to requests per revisions.
Model Scaling
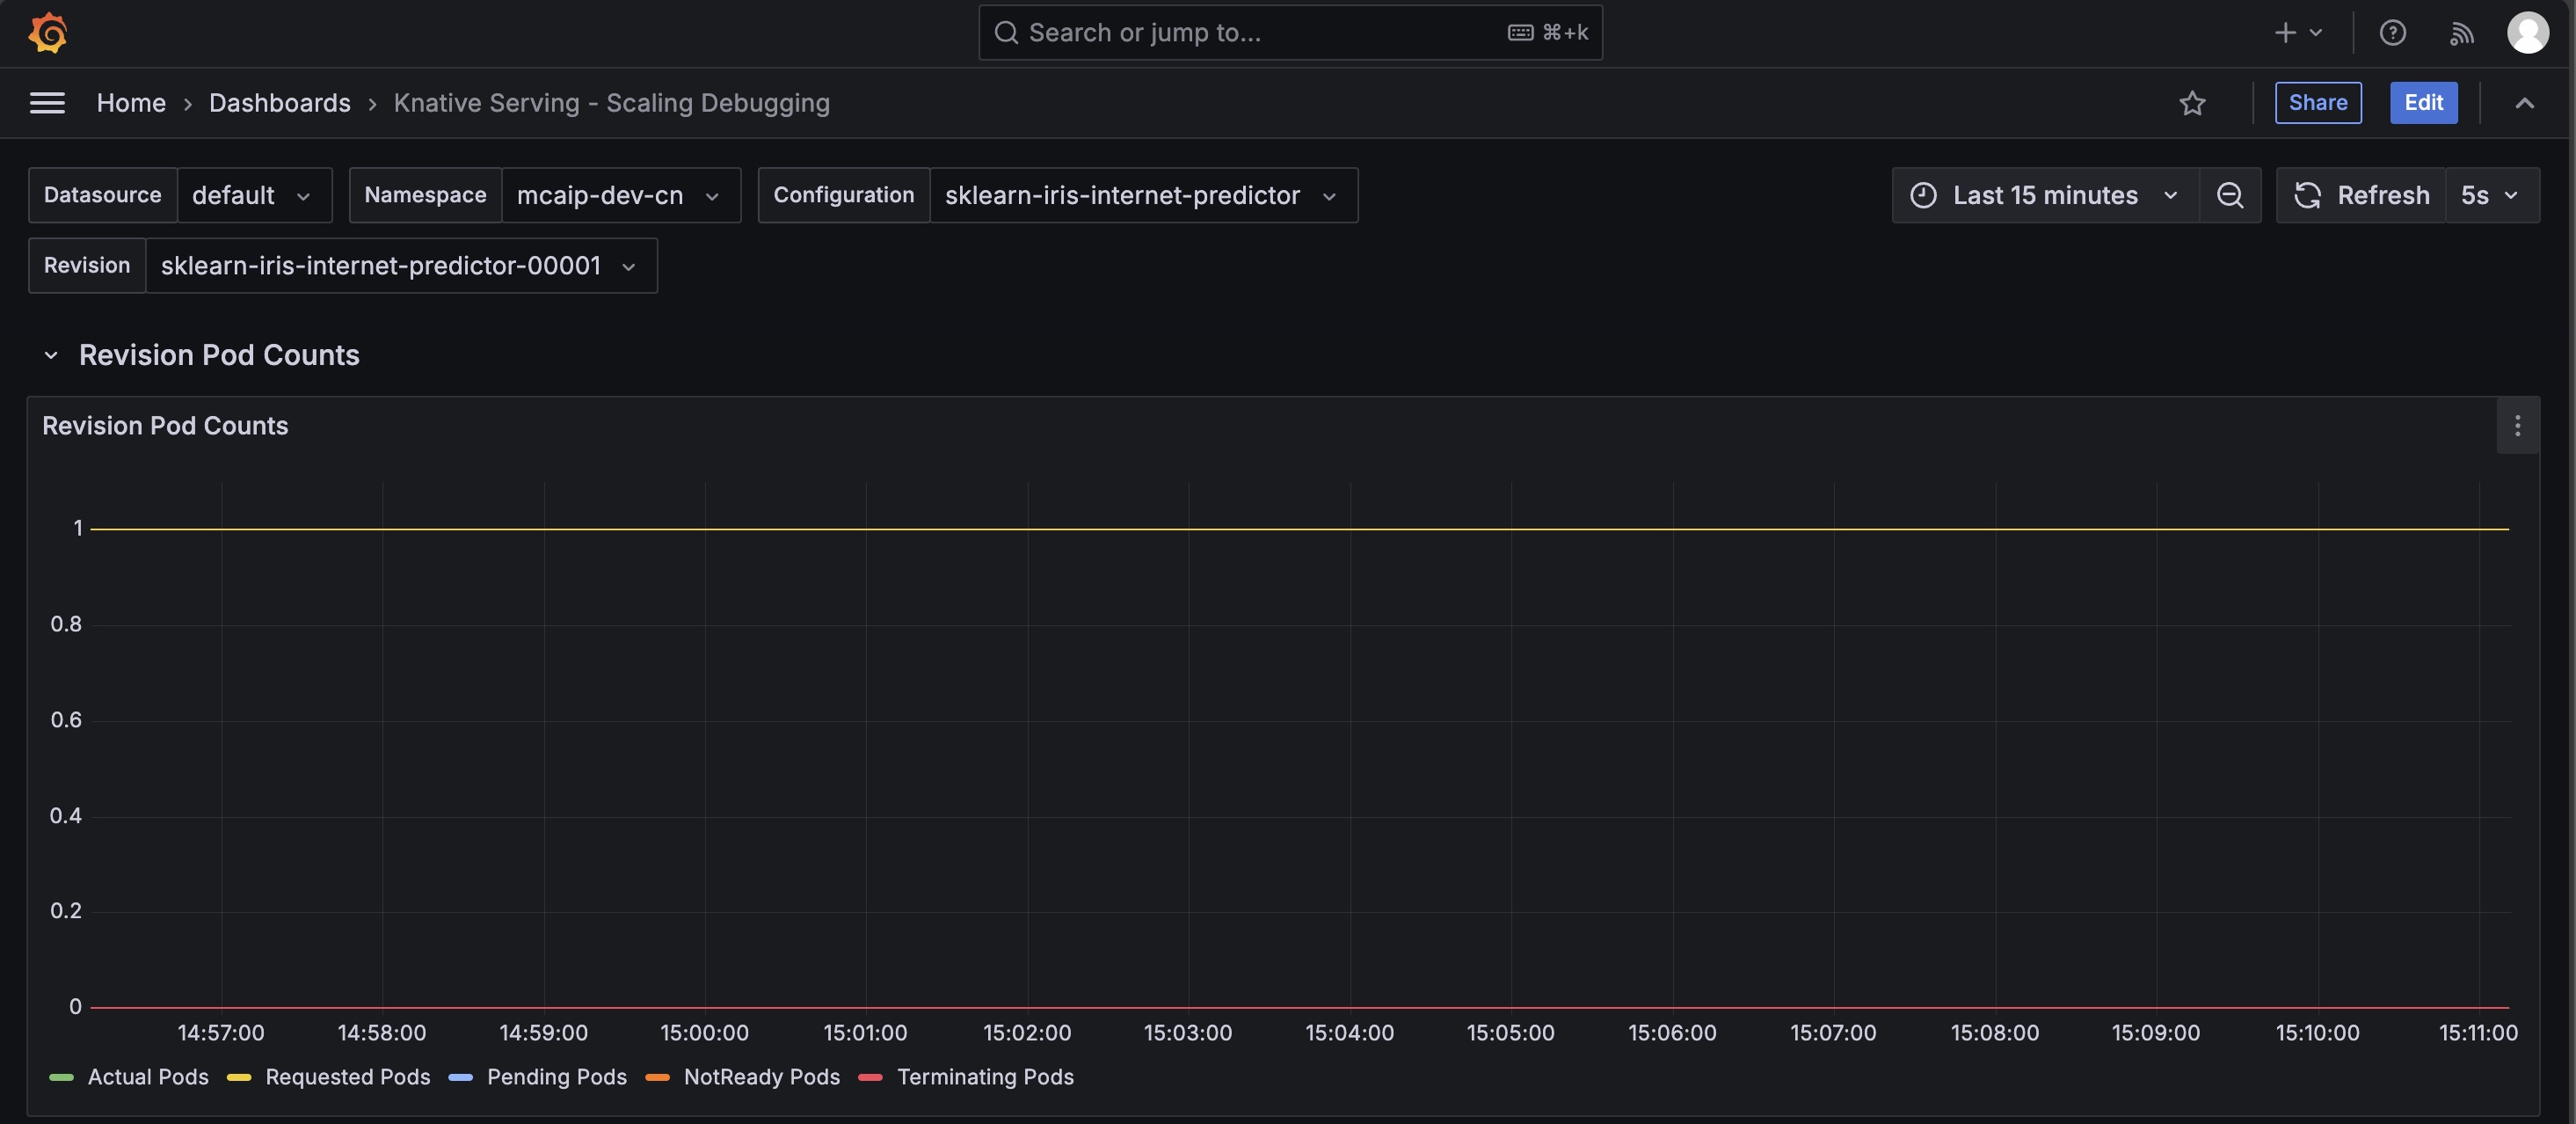
To debug information regarding scaling of a model, users can check out Knative Serving - Scaling Debugging option. This shows how many pods are serving your model parallely and metrics related to autoscaling of the model serving. Here also you can check out individually the scaling metrics for predictor and transformers in your own namespace (profile) and how many pods a particular revision (version of model) is using.
Request/Response Logs on S3
Adjust InferenceService
To setup logging for your InferenceService using the infrastructure provided from KServe helm-chart you need to add the logging service URL on top of the InferenceService object (Model Server) that you're deploying, the default URL is http://kserve-event-display.kserve/ like in the example below:
apiVersion: serving.kserve.io/v1beta1
kind: InferenceService
metadata:
  name: your-model
  annotations:
    serving.kserve.io/logger-url: "http://kserve-event-display.kserve/"
spec:
  predictor:
    serviceAccountName: default-editor
    # ... rest of your configuration
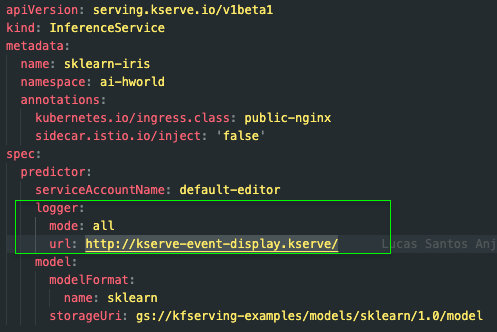
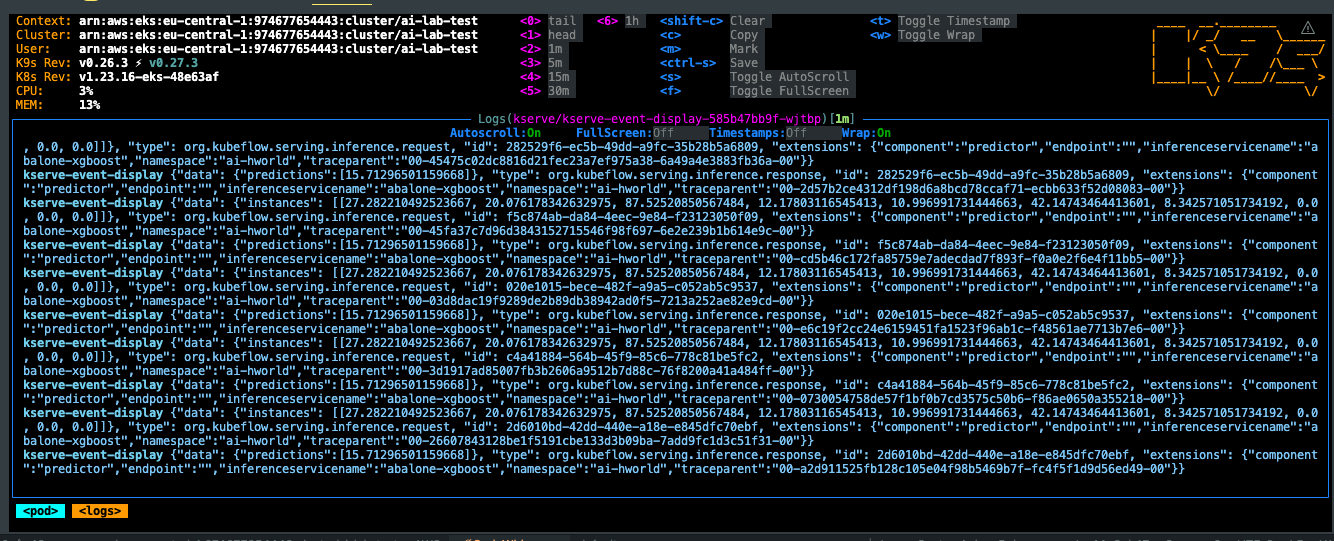
You can check if your events are being forwarded properly to event-display component and the S3 bucket assigned by checking its logs on k9s, they will be shown up like in the screenshots below:
S3 Bucket and Prefix
By default, the S3 bucket used on KServe event-display will be logs-${var.product_name}-${var.env}-${var.region} if no value is assigned on key modules.knative.dependencies.kserve_event_display_bucket located on product.yaml.
The bucket prefix where logs will be located is:
/kserve-event-display/$PRODUCT_NAME/$ENVIRONMENT_NAME/$FILE_NUMBER/%Y/%m/%d/%Y%m%d%H%M%S
To customize the default bucket used for KServe logging you need to add a value on product.yaml file key modules.knative.dependencies.kserve_event_display_bucket:
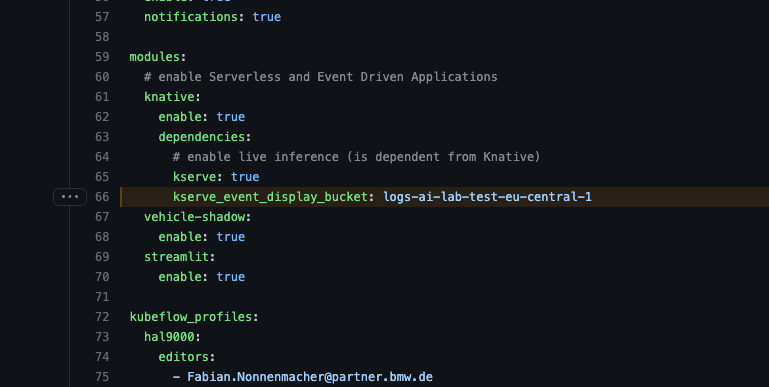
Example product.yaml configuration:
modules:
  knative:
    dependencies:
      kserve_event_display_bucket: "custom-logging-bucket-name"
This allows you to:
- Track all inference requests and responses
- Debug model performance issues
- Analyze usage patterns
- Monitor model behavior in production
- Maintain audit trails for compliance