Monitoring
The Connected AI Platform provides users with a comprehensive monitoring system to keep track of their applications' performance and health.
This is only available for applications deployed on the platform that expose metrics on the endpoint /metrics. This is a common standard for metrics exposition, and many frameworks and libraries support it out of the box (e.g. Prometheus client libraries).
Example
When building an FastAPI application, you can easily expose metrics by using the prometheus_fastapi_instrumentator library. This library provides a simple way to instrument your FastAPI application and expose metrics in the Prometheus format. Here's a basic example of how to use it:
from fastapi import FastAPI
from prometheus_fastapi_instrumentator import Instrumentator

app = FastAPI()

instrumentator = Instrumentator(excluded_handlers=["/metrics", "/health"])
instrumentator.instrument(app).expose(app)
In this example, we create a FastAPI application and use the Instrumentator to instrument the app and expose the metrics at the /metrics endpoint. Once deployed on the Connected AI Platform, the platform automatically manages those metrics, exporting them to a Grafana Cloud instance. You can access these metrics to monitor your application's performance and health.
Dashboard
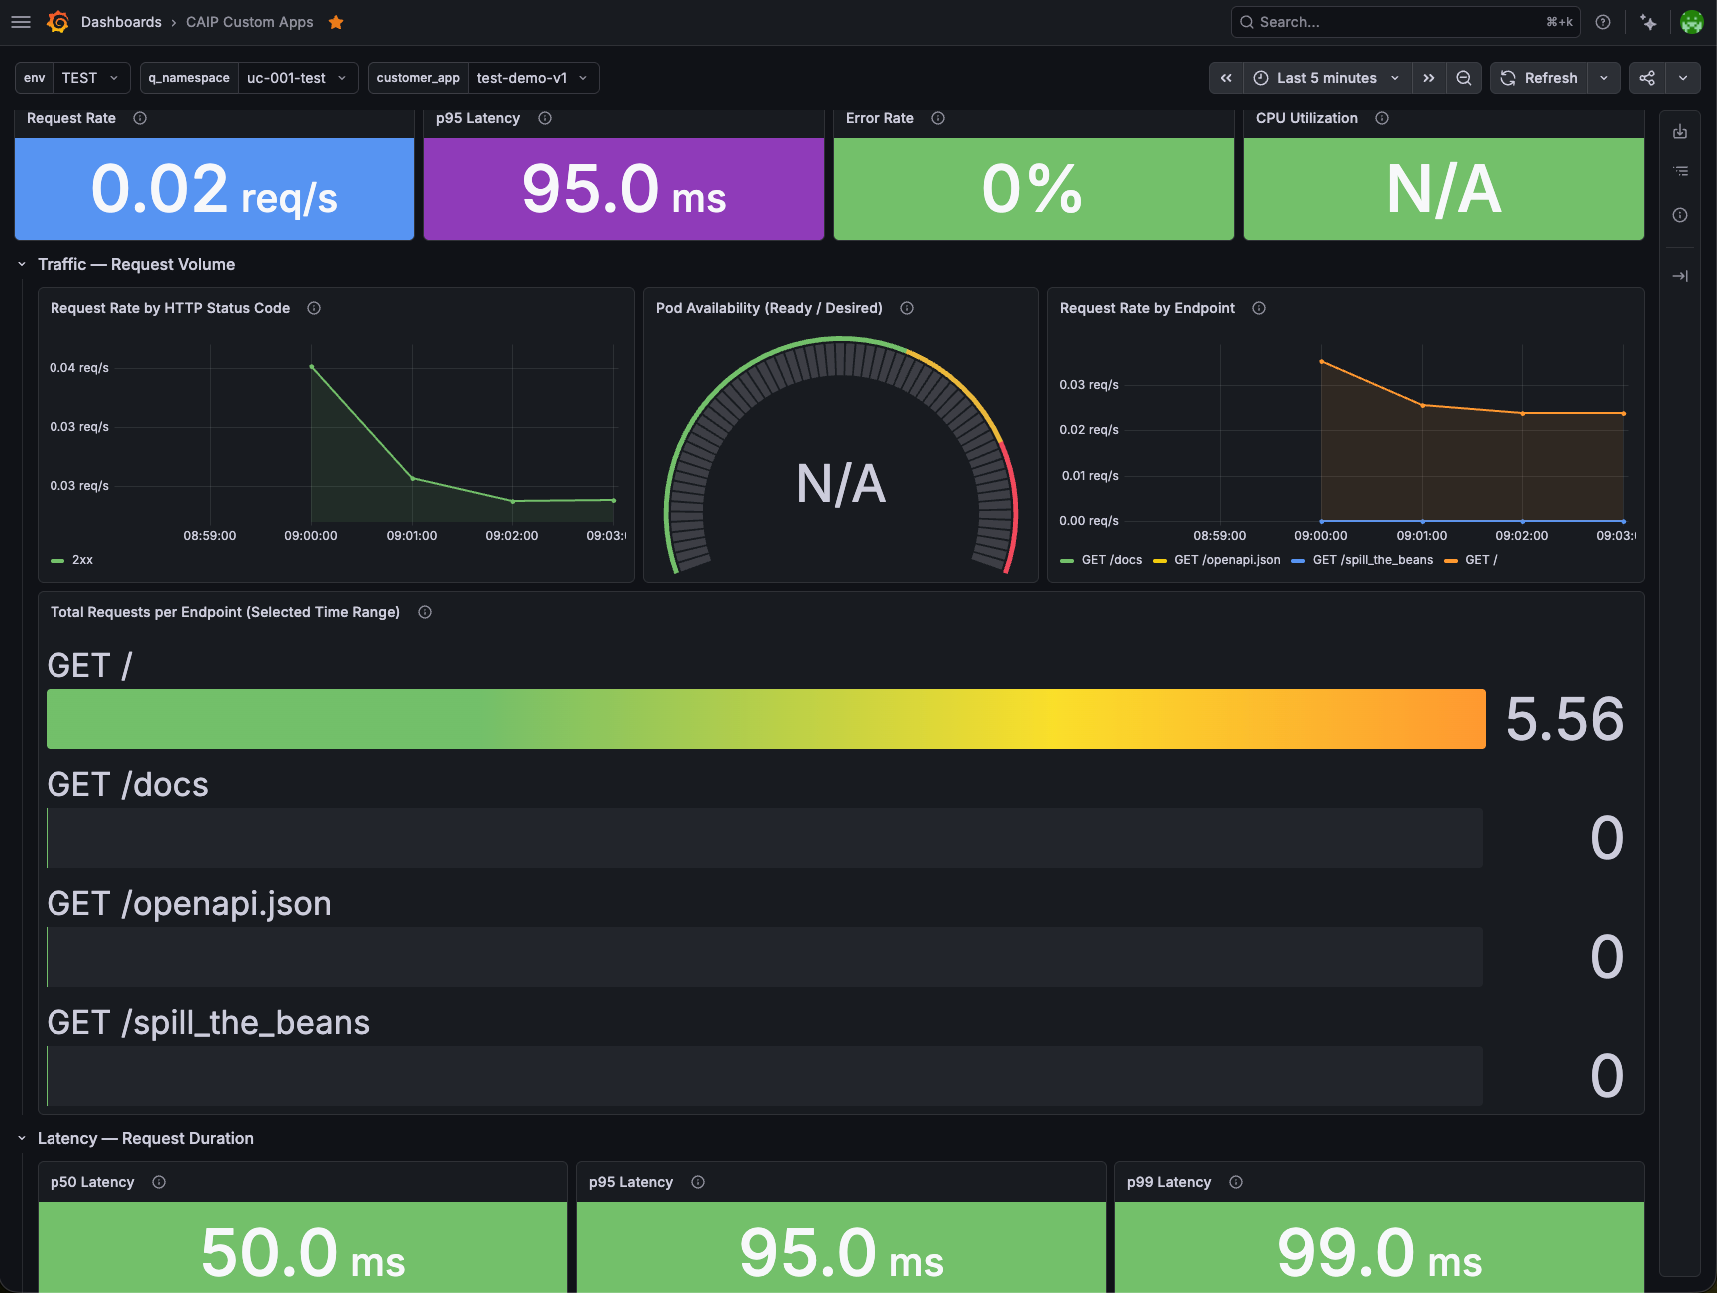
Currently, there is a default dashboard available on Grafana Cloud for every application deployed on the platform, where you can find some pre-configured panels with common metrics such as CPU and memory usage, request latency, and error rates.
The dashboard is automatically created for every application deployed on the platform, and you can access it through the Grafana Cloud instance provided by the platform. This allows you to easily monitor your application's performance and health without having to set up your own monitoring infrastructure.
The dashboard is available on this URL
The user can look at the deployed application by selecting the following fields:
- Cluster environment (env): options
test,intandprod - Namespace where the app is deployed (q_namespace): in the format
(space_id)-(user_env) - App (customer_app) in the format of
(app_name)-(deploy_name)
An example of the outcome is the following dashboard