Langfuse Observability
What is Observability?
Observability is the ability to understand what's happening inside your application by examining its outputs — logs, metrics, and traces. For AI applications, observability answers critical questions:
- What prompts were sent to the LLM?
- Why did the agent make that decision?
- How long did each step take?
- How much did this request cost?
- Why did this conversation fail?
Without observability, debugging AI applications is like flying blind — you see inputs and outputs but have no visibility into the complex reasoning happening in between.
What is Langfuse?
Langfuse is an open-source LLM observability platform that provides comprehensive tracing, debugging, and monitoring for your AI agents and LLM applications. Think of it as "DevTools for AI" — giving you full visibility into every LLM call, agent step, tool invocation, and decision point.
CAIP Langfuse Instance
CAIP provides a managed Langfuse instance with BMW WebEAM SSO authentication:
| Region | Environment | URL |
|---|---|---|
| ROW | Production | https://langfuse.caip.bmw.cloud/ |
| CN | Production | https://langfuse.caip.bmwchina.cloud/ |
Login with your BMW WebEAM credentials — the same credentials you use for other BMW systems.
Key Features
🔍 Distributed Tracing
Track every operation in your AI application as a hierarchical trace:
Trace: "answer_user_question" (2,340ms)
├── Span: "validate_input" (15ms)
├── Span: "search_knowledge_base" (450ms)
│   ├── Span: "embed_query" (120ms)
│   └── Span: "vector_search" (330ms)
├── Generation: "gpt-4o" (1,750ms)
│   ├── Input: 2,456 tokens ($0.0245)
│   ├── Output: 512 tokens ($0.0154)
│   └── Total Cost: $0.0399
└── Span: "format_response" (125ms)
Benefits:
- See the complete execution flow at a glance
- Identify slow operations immediately
- Understand parent-child relationships between operations
🐛 Debug & Inspect
Drill into any trace to see exact inputs, outputs, and metadata:
- LLM Prompts: See exactly what was sent to the model
- Model Responses: View complete generated text
- Tool Calls: Inspect function arguments and return values
- Errors: See stack traces and error context
💰 Cost Tracking
Monitor token usage and estimated costs across all your models:
| Metric | Description |
|---|---|
| Input Tokens | Tokens in prompts (charged at input rate) |
| Output Tokens | Tokens in completions (charged at output rate) |
| Estimated Cost | Calculated from token counts and model pricing |
| Cost by Model | Breakdown of spending per model |
👤 User & Session Tracking
Group traces by user and session for conversation-level debugging:
- User ID: Find all traces for a specific user
- Session ID: View complete conversation threads
- Tags: Add custom labels for filtering (e.g.,
production,beta-feature)
📈 Analytics Dashboard
Visualize trends and patterns across your application:
- Request volume over time
- Latency percentiles (P50, P95, P99)
- Error rates and failure patterns
- Token usage trends
- Cost projections
Architecture Overview
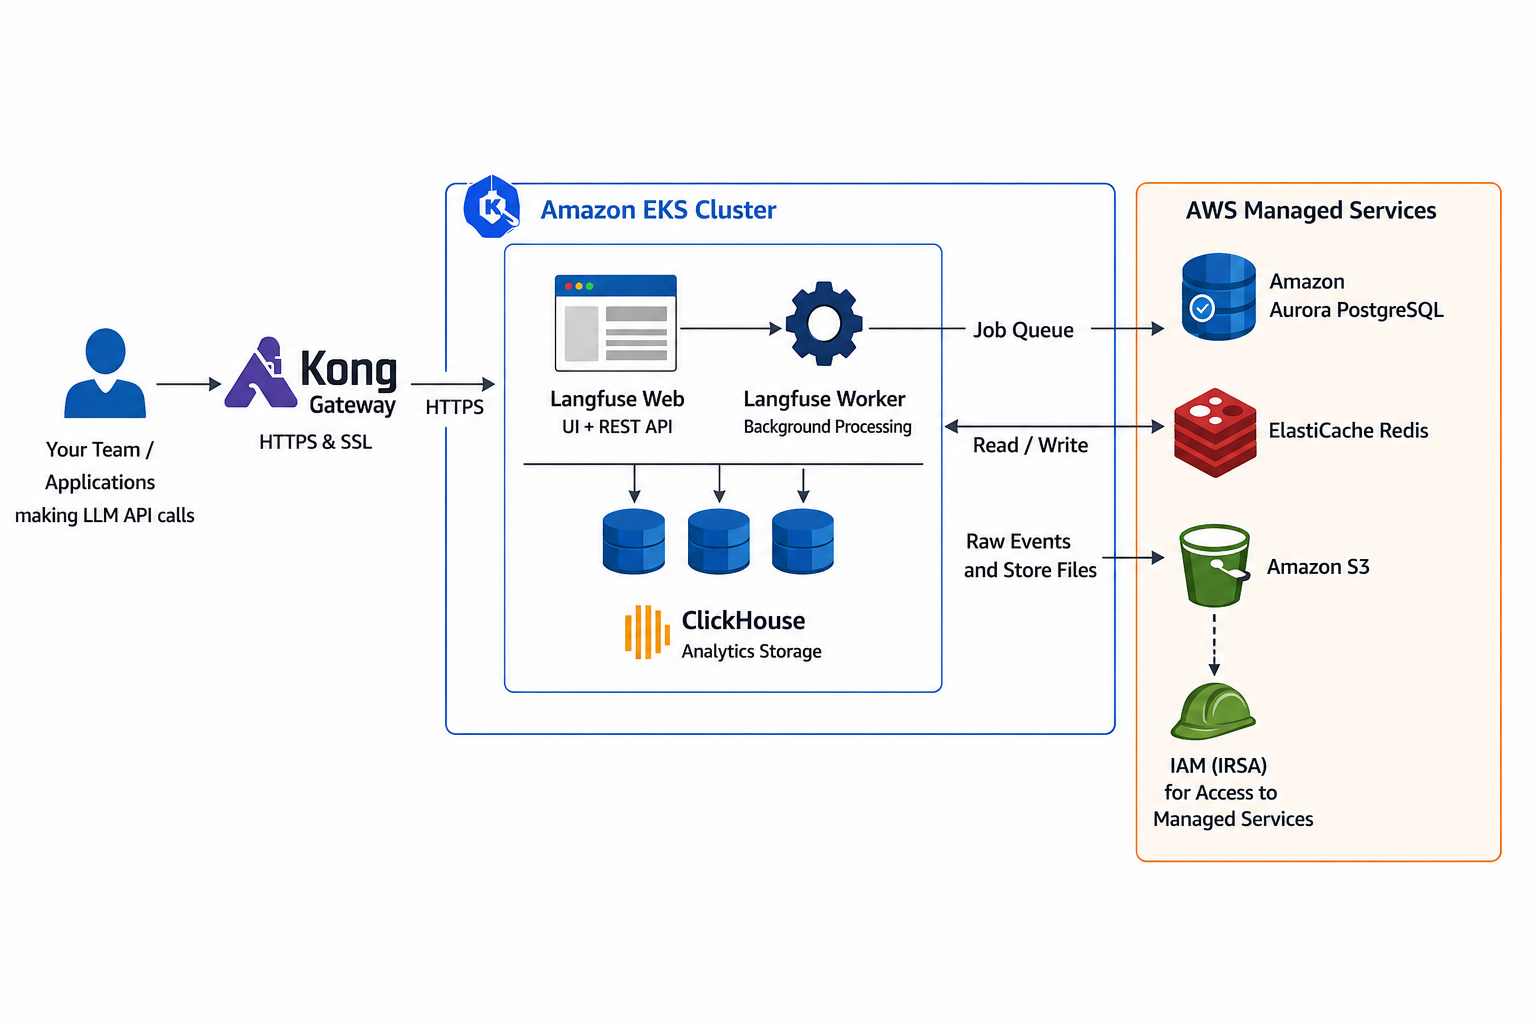
How it works:
- Your Application — Your CAIP Agents code instrumented with
@observedecorators - CAIP Agents SDK — Automatically captures LLM calls, tool invocations, and custom spans)
- Langfuse Server — Receives, stores, and indexes trace data
- Dashboard — Web UI for viewing and analyzing traces
Traces are sent asynchronously in the background, so observability adds minimal latency to your application.
Integration Options
Langfuse integrates with CAIP applications in multiple ways:
| Method | Use Case | Complexity |
|---|---|---|
| CAIP Agents SDK (Full) | Building agents with full SDK features + observability. See the Agents SDK Installation Guide. | Easiest ⭐ |
| CAIP Agents SDK (Observability Only) | Just need @observe without agent features. Install via the Agents SDK Installation Guide. | Easy |
| Langfuse MCP Server | AI coding assistants (Cursor, Claude Code, VS Code) — no code needed | Easy |
| Langfuse Python SDK | Custom LLM apps without CAIP SDK | Moderate |
| OpenTelemetry (OTLP) | Non-Python apps (Java, Go, .NET) or existing OTel setups | Moderate |
See the Getting Started guide for detailed setup instructions for each method.
Quick Example
Add observability to your code with a single decorator:
from caip_agents_sdk.observability import observe, propagate_attributes

@observe(name="chat_handler")
async def handle_chat(user_id: str, message: str):
    # Automatically tracked in Langfuse
    with propagate_attributes(user_id=user_id, session_id="sess_123"):
        response = await agent.run(message)
        return response
This creates a trace showing:
- The user who made the request
- The session it belongs to
- All nested LLM calls and tool invocations
- Token counts and costs
- Execution time for each step
Advanced Features
Langfuse provides a rich set of capabilities beyond tracing and monitoring. The following features are available in the Langfuse platform and will be offered through CAIP as part of our roadmap.
These features are supported by Langfuse and are being evaluated for CAIP integration. You can explore them today via the official Langfuse documentation.
📊 Scores & Evaluation
Attach quality scores to traces and observations — either programmatically or via the UI.
| Feature | Description |
|---|---|
| Scores | Attach numeric, boolean, or categorical scores to any trace or observation |
| Score Configs | Define custom score schemas with data types, categories, and value ranges |
| Score Analytics | Visualize score trends over time on custom dashboards |
📖 Langfuse Scores Documentation
🤖 LLM-as-a-Judge
Use LLMs to automatically evaluate the quality of your AI outputs at scale.
| Feature | Description |
|---|---|
| LLM-as-a-Judge Evaluators | Configure LLM-based evaluators that auto-score traces in production |
| Custom Eval Templates | Define evaluation criteria with custom prompts and scoring rubrics |
| Online Evaluation | Run evaluators automatically on live production traces |
📖 Langfuse LLM-as-a-Judge Documentation
📋 Datasets & Experiments
Build reusable test datasets and run experiments to compare prompt, model, or code changes.
| Feature | Description |
|---|---|
| Datasets | Create collections of test inputs from production traces or manual curation |
| Experiments | Run datasets against different configurations and compare results side-by-side |
| CI/CD Integration | Block deploys on quality regressions with automated experiment checks |
📖 Langfuse Datasets Documentation
✍️ Human Annotations
Enable human review workflows for trace quality assessment.
| Feature | Description |
|---|---|
| Annotation Queues | Create review queues for human evaluators to rate traces |
| Manual Scoring via UI | Review and score traces directly in the Langfuse dashboard |
| Text Annotations | Leave open-ended notes and comments on any trace |
📖 Langfuse Annotation Documentation
📝 Prompt Management
Manage, version, and deploy prompts separately from your application code.
| Feature | Description |
|---|---|
| Prompt Versioning | Store and version prompts centrally with labels (e.g., production, staging) |
| Prompt Playground | Test prompts directly in the Langfuse UI with different models |
| SDK Integration | Fetch managed prompts from your application code via SDK |
📖 Langfuse Prompt Management Documentation
🔧 Additional Capabilities
| Feature | Description |
|---|---|
| Playground | Test LLM calls with different models and parameters directly in the UI |
| Metrics & Custom Dashboards | Create custom dashboards with advanced metric widgets |
| MCP Server | Access Langfuse data from AI coding assistants via Model Context Protocol |
| OpenTelemetry Integration | Send traces from any language (Java, Go, .NET, etc.) using the OpenTelemetry standard |
Documentation
Getting Started
Set up Langfuse observability with your CAIP Agents SDK project
UI Guide
Navigate the Langfuse dashboard and understand the main sections
Project Settings
Configure your Langfuse project, manage API keys, and control access
Tracing Guide
Complete guide to instrumenting, viewing, and analyzing traces in Langfuse
Data Masking
How CAIP Agents SDK masks sensitive data before it reaches Langfuse
Users & Sessions
Track and analyze user activity and conversation sessions in Langfuse
Best Practices
Production-ready patterns for Langfuse observability
Complete Examples
Ready-to-run CAIP Agents SDK examples with full Langfuse observability