Getting Started with Langfuse
This guide walks you through setting up Langfuse observability for your AI applications. By the end, you'll have traces flowing from your code to the Langfuse dashboard.
Overview
Prerequisites
- BMW WebEAM account — For dashboard access
- Python 3.12 — For running your application
Step 1: Create or Manage a Langfuse Project
Please open a service request to create a new Langfuse Project, or to manage users and roles on an existing one.
When you submit the project request, you automatically become the Project Admin. This gives you full control over the project.
| Role | Permissions |
|---|---|
| Admin | Create API keys, invite members, promote others to Admin, manage settings |
| Member | View traces, create generations, cannot manage settings |
| Viewer | Read-only access to traces and dashboards |
Step 2: Access Langfuse & Create API Keys
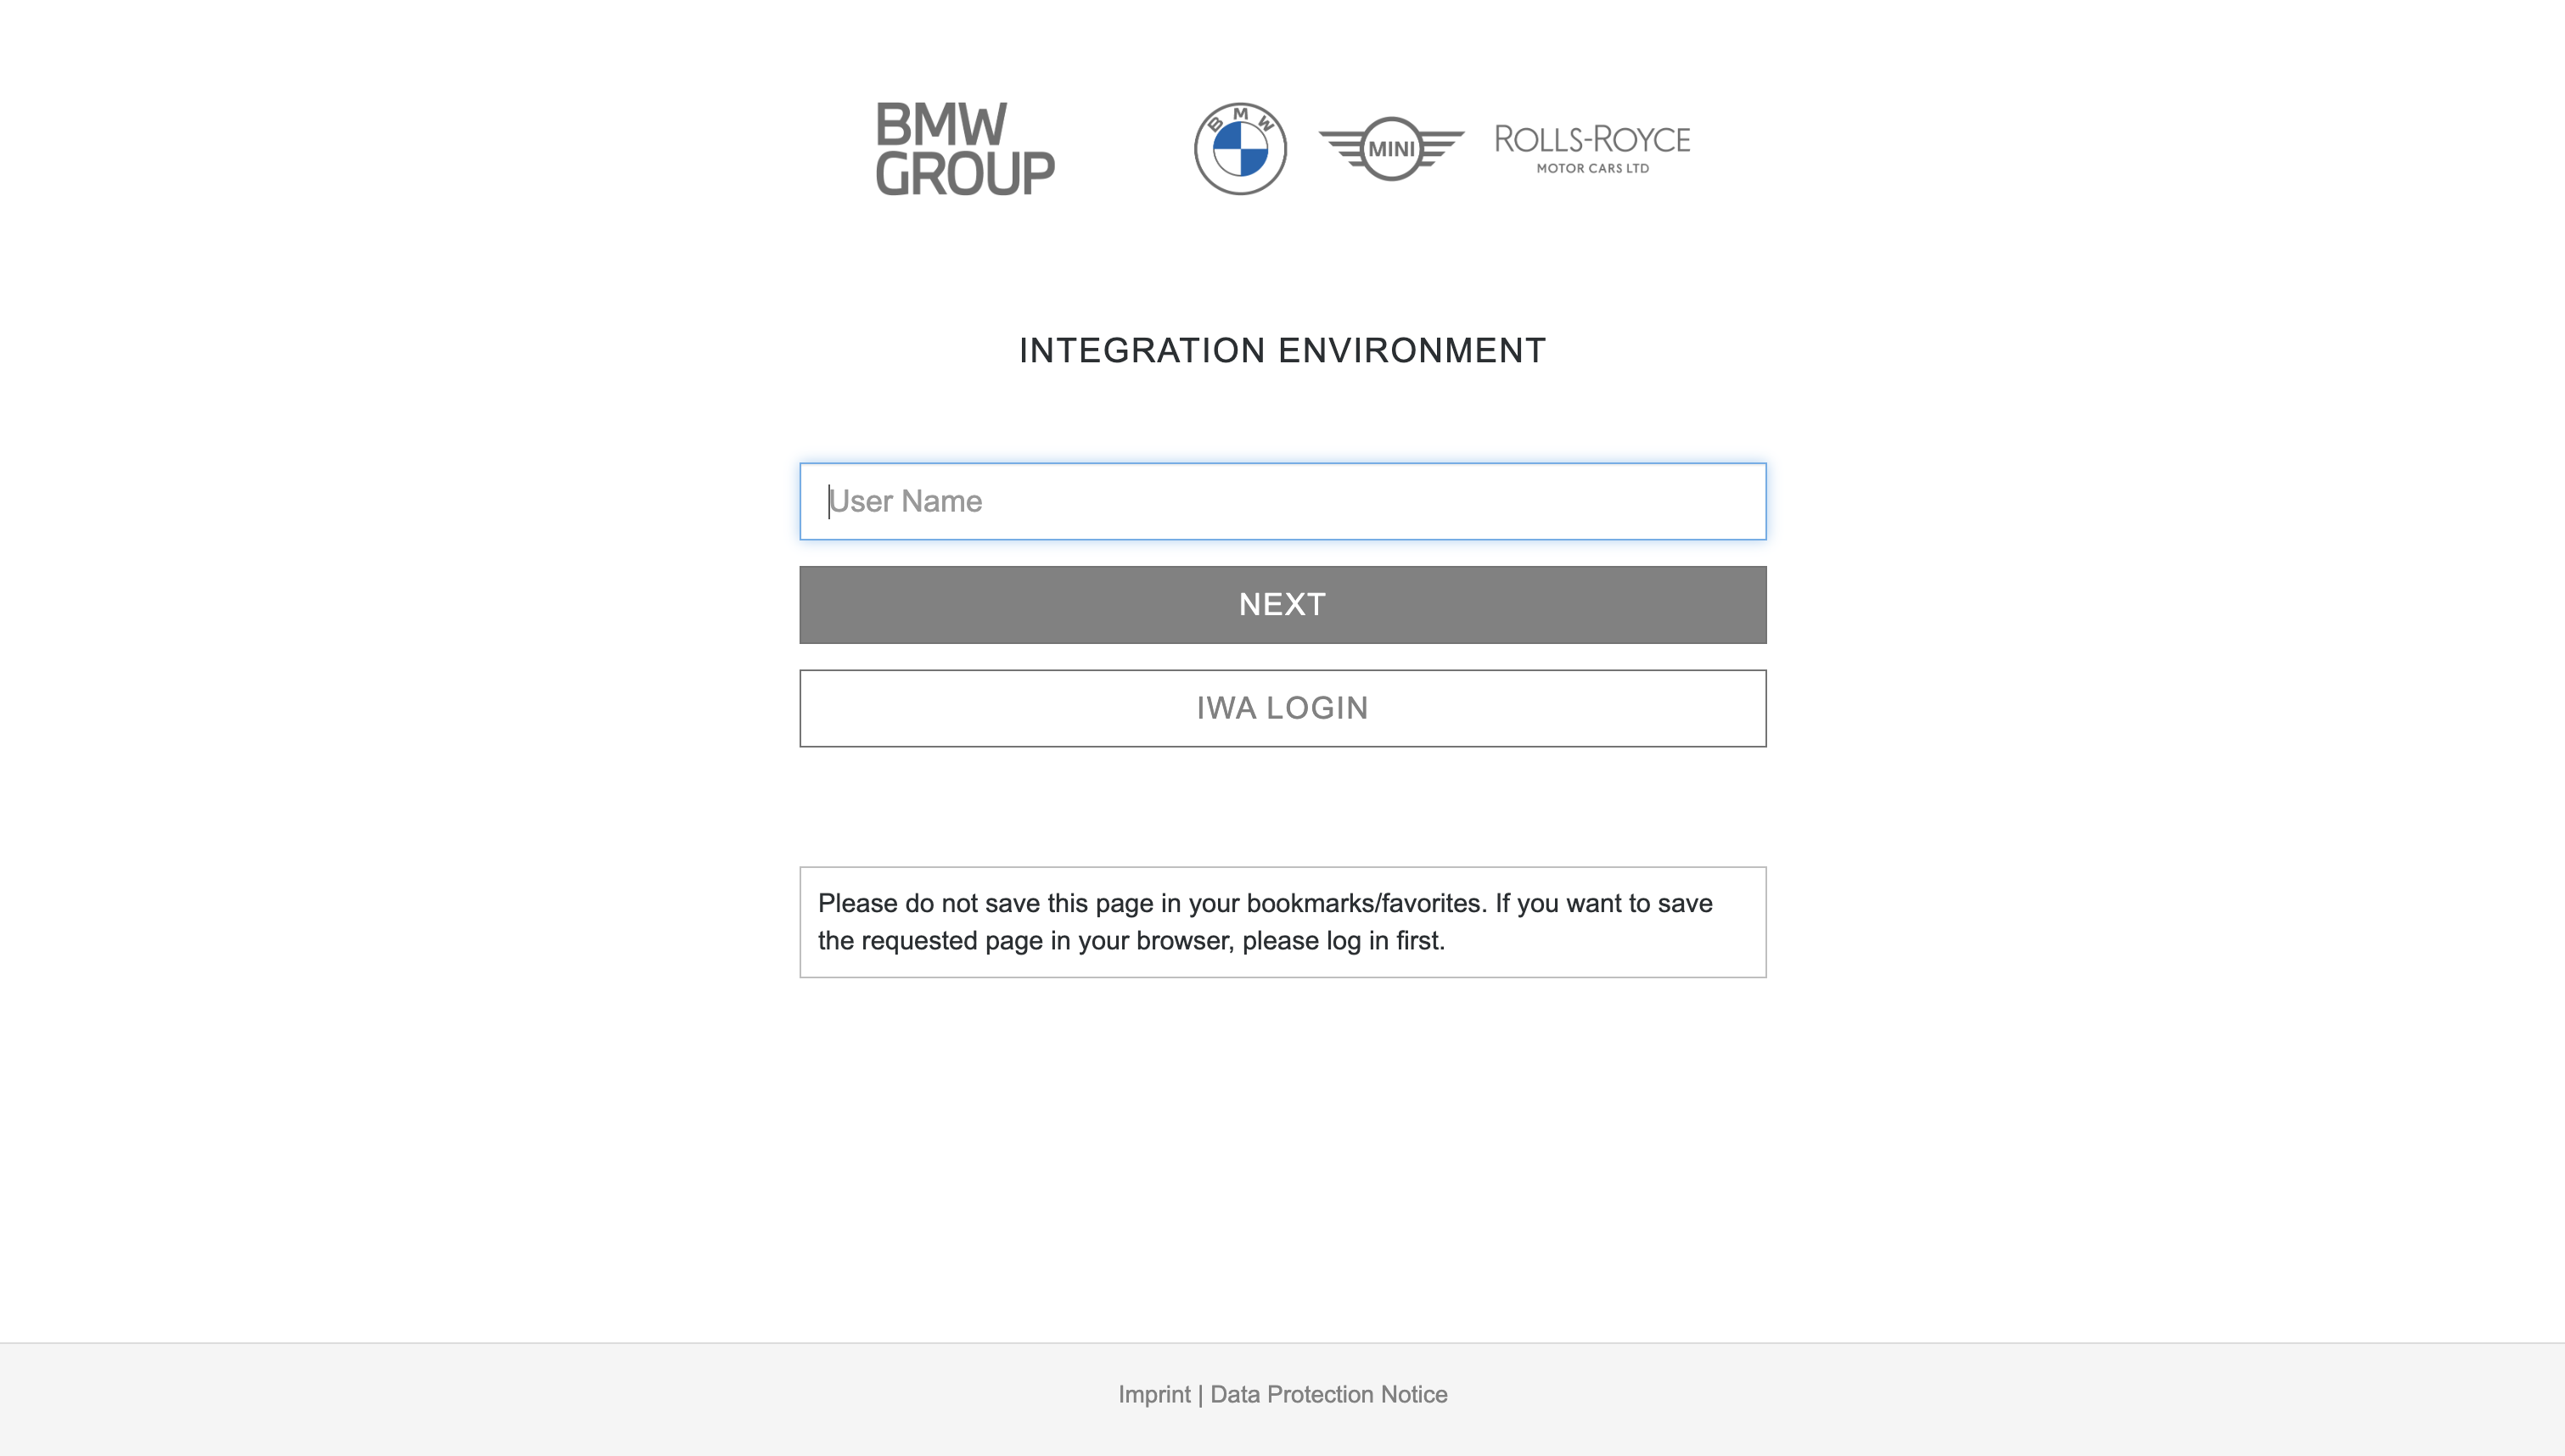
Login to Langfuse
Navigate to the Langfuse dashboard and sign in with your BMW WebEAM credentials:
| Region | Environment | URL |
|---|---|---|
| ROW | Production | langfuse.caip.bmw.cloud |
| CN | Production | langfuse.caip.bmwchina.cloud |
Create API Keys (Admin Only)
As a project admin, you can create API keys for your application:
- Navigate to Settings → API Keys
- Click Create new API key
- Copy both keys immediately:
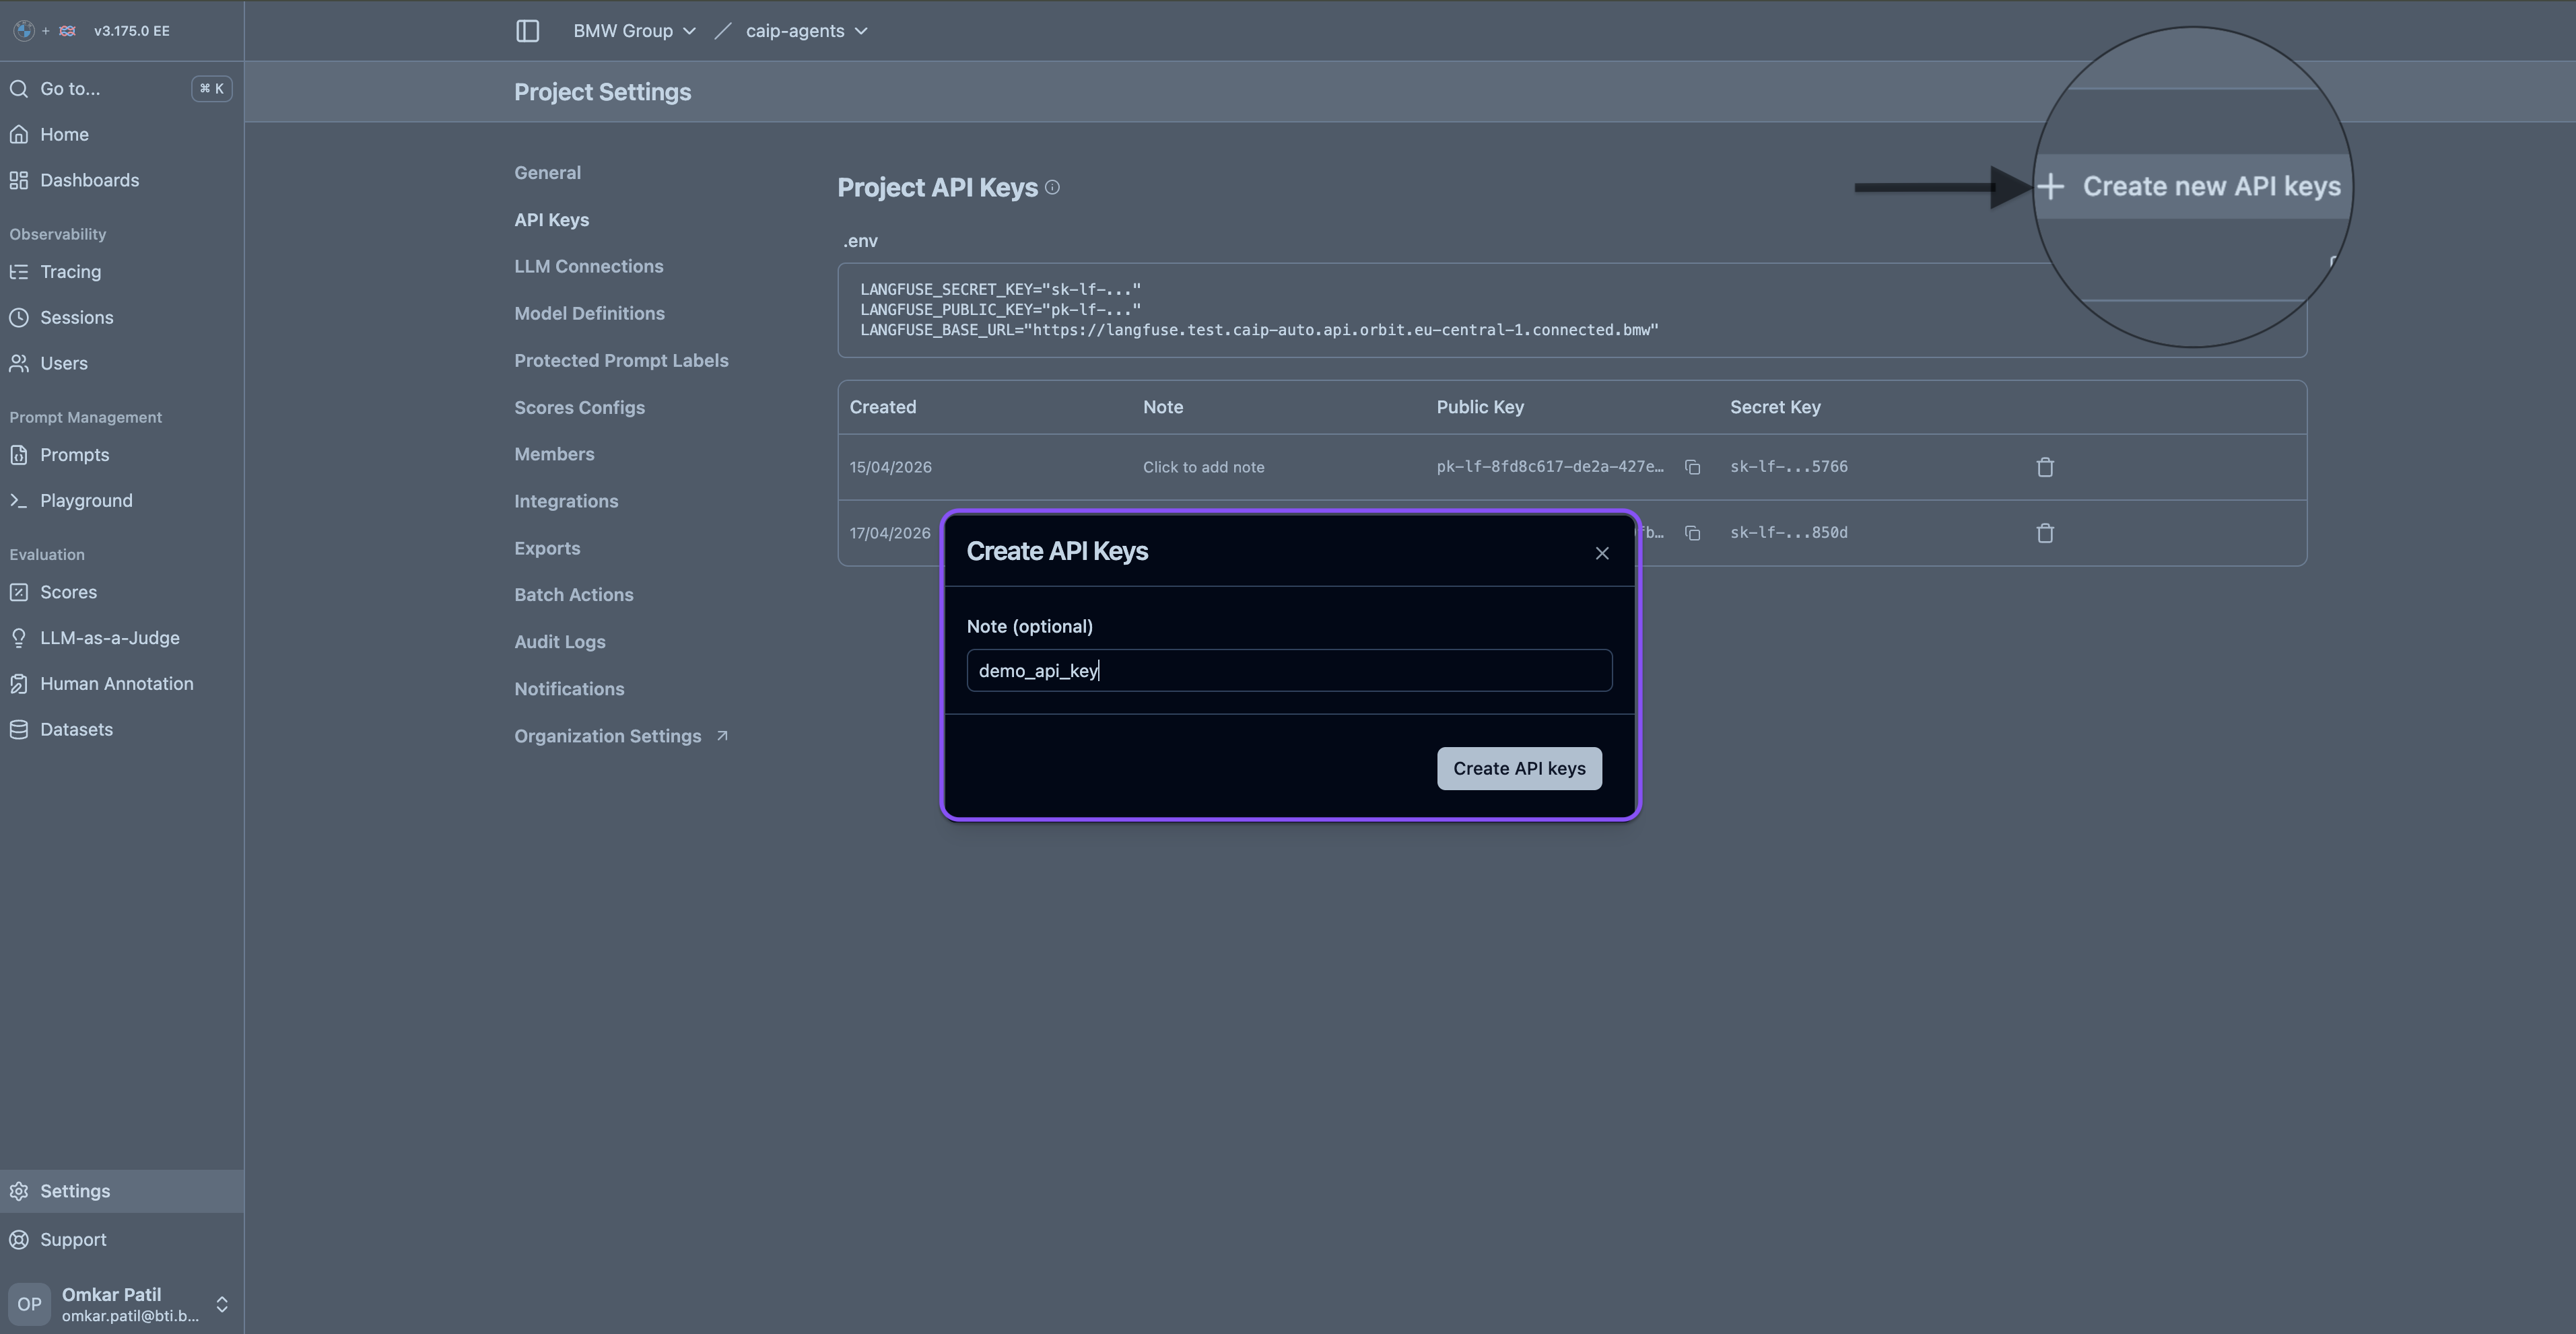
The secret key is displayed only at creation time. Store it securely in a password manager or secret vault. Never commit it to version control.
Add Team Members (Admin Only)
To give your team access to view traces:
- Go to Settings → Members
- Click Invite Member
- Enter their BMW email address
- Select their role (Admin, Member, or Viewer)
Step 3: Configure Your Application
Add Langfuse credentials to your environment:
Langfuse observability is enabled by default in the SDK. You only need to set CAIP_LANGFUSE_OBSERVABILITY=false if you want to disable tracing.
# Langfuse Configuration
LANGFUSE_PUBLIC_KEY=pk-lf-xxxxxxxx-xxxx-xxxx-xxxx-xxxxxxxxxxxx
LANGFUSE_SECRET_KEY=sk-lf-xxxxxxxx-xxxx-xxxx-xxxx-xxxxxxxxxxxx

# Langfuse server URL
# ROW
LANGFUSE_HOST=https://langfuse.caip.bmw.cloud

# CN
# LANGFUSE_HOST=https://langfuse.caip.bmwchina.cloud

# Environment tag (appears in Langfuse UI for filtering)
LANGFUSE_ENV=prod
| Variable | Description |
|---|---|
LANGFUSE_PUBLIC_KEY | Your project's public key (starts with pk-lf-) |
LANGFUSE_SECRET_KEY | Your project's secret key (starts with sk-lf-) |
LANGFUSE_HOST | Langfuse server URL |
LANGFUSE_ENV | Environment tag for filtering (e.g., test, prod) |
LANGFUSE_DEBUG | Set to true for verbose trace logging (see Troubleshooting) |
To disable observability explicitly:
CAIP_LANGFUSE_OBSERVABILITY=false
Use environment variables or a secrets manager. Never hardcode credentials in your code.
Step 4: Choose Your Integration Method
Langfuse can be integrated in multiple ways, depending on your use case:
- 🚀 CAIP Agents SDK (Full)
- 📍 CAIP SDK (Observability Only)
- 🔧 Langfuse Python SDK
- 🔌 Langfuse MCP Server
- 📡 OpenTelemetry (OTLP)
Best for: Building AI agents with the CAIP platform
This is the recommended approach. The CAIP Agents SDK provides automatic tracing for all agent operations, plus the @observe decorator for custom instrumentation.
For CAIP agent routing, you can optionally set CAIP_REGION to ROW or CN. If not set, the SDK defaults to ROW.
Install
pip install caip-agents-sdk --upgrade \
  --index-url https://packages.orbit.bmwgroup.net/artifactory/api/pypi/connected-ai-platform-pypi-local-public/simple \
  --extra-index-url https://pypi.org/simple
Example: Agent with Automatic Tracing
import asyncio, os
from caip_agents_sdk import CAIPAgentsClient
from caip_agents_sdk.observability import observe, propagate_attributes, flush

async def main():
    # Initialize client - Langfuse is auto-configured from env vars
    client = CAIPAgentsClient()

    # Create agent - all LLM calls are automatically traced
    agent = client.create_agent(
        framework="pydantic_ai",
        agent_id=os.getenv("CAIP_AGENT_ID"),
    )
    await agent.initialize()
    thread = await client.create_thread(
        agent_id=os.getenv("CAIP_AGENT_ID"),
        thread_data={"title": "Hello World", "status": "open"},
    )
    agent.thread_id = thread.threadId
    # Add user context for trace filtering
    with propagate_attributes(
        user_id="user_123",
        session_id="session_456",
        tags=["production", "chat-bot"]
    ):
        # This entire operation is traced automatically
        result = await agent.run("What is the weather in Munich?")
        print(result.output)

    # Flush traces before exit
    flush()

if __name__ == "__main__":
    asyncio.run(main())
What gets traced automatically:
- Agent initialization
- LLM calls (with token counts and costs) — named
caip.pydantic_ai.run,caip.pydantic_ai.stream, orcaip.pydantic_ai.iter - Tool invocations — named
caip.tool.{tool_name} - Message persistence — named
caip.api.{endpoint}
Best for: Adding tracing to existing code without using CAIP agent features
Use the @observe decorator and propagate_attributes from the CAIP SDK to trace any Python function.
Install
pip install caip-agents-sdk --upgrade \
  --index-url https://packages.orbit.bmwgroup.net/artifactory/api/pypi/connected-ai-platform-pypi-local-public/simple \
  --extra-index-url https://pypi.org/simple
Example: Custom Functions with Tracing
import asyncio
from dotenv import load_dotenv
from caip_agents_sdk.observability import observe, propagate_attributes, flush, get_client

load_dotenv()

@observe(name="process_query")
async def process_query(query: str) -> str:
    """Parent span - automatically traced."""
    context = await fetch_context(query)
    response = await generate_response(query, context)
    return response

@observe(name="fetch_context", as_type="retriever")
async def fetch_context(query: str) -> dict:
    """Child span - linked to parent automatically."""
    # Your retrieval logic here
    return {"documents": ["doc1", "doc2"]}

@observe(name="generate_response", as_type="generation")
async def generate_response(query: str, context: dict) -> str:
    """Generation span - for LLM calls."""
    # Your LLM call here
    return f"Response to: {query}"

async def main():
    # Add user context
    with propagate_attributes(
        user_id="user_abc",
        session_id="session_xyz"
    ):
        result = await process_query("How do I deploy an agent?")
        print(result)

    # Flush traces
    flush()

if __name__ == "__main__":
    asyncio.run(main())
Observation types:
| Type | Use Case |
|---|---|
span | General operations (default) |
generation | LLM calls |
retriever | Vector/document retrieval |
tool | Tool/function invocations |
agent | Agent orchestration |
Best for: Custom LLM applications without CAIP SDK dependencies
Use the official Langfuse Python SDK for direct integration.
Install
pip install langfuse
Example: Direct Langfuse SDK
import asyncio
from dotenv import load_dotenv
from langfuse import observe, Langfuse

load_dotenv()

# Initialize Langfuse client
langfuse = Langfuse()

@observe()
async def process_query(query: str) -> str:
    """Traced with Langfuse decorator."""
    response = await call_llm(query)
    return response

@observe(as_type="generation")
async def call_llm(query: str) -> str:
    """LLM generation span."""
    # Your LLM call here
    return f"Response to: {query}"

async def main():
    result = await process_query("What is CAIP?")
    print(result)

    # Flush traces
    langfuse.flush()

if __name__ == "__main__":
    asyncio.run(main())
Note: When using the Langfuse SDK directly, you manage the client lifecycle yourself. See the Langfuse documentation for advanced features.
Best for: AI coding assistants and agents that support MCP (Model Context Protocol) — the easiest way to interact with your Langfuse data without writing any integration code.
The Langfuse MCP Server lets tools like Claude Code, Cursor, VS Code Copilot, and other MCP-compatible clients access your Langfuse project data directly — browse traces, manage prompts, and query metrics from your AI assistant.
Step 1: Get Your Authentication Token
Generate a Base64-encoded token from your Langfuse API keys:
echo -n "pk-lf-your-public-key:sk-lf-your-secret-key" | base64
Step 2: Configure Your MCP Client
Since CAIP runs a self-hosted Langfuse instance, use the self-hosted endpoint:
For China region, replace https://langfuse.caip.bmw.cloud with https://langfuse.caip.bmwchina.cloud in all MCP and OTEL endpoint examples below.
Endpoint: https://langfuse.caip.bmw.cloud/api/public/mcp
Transport: streamableHttp
Auth: Basic {your-base64-token}
Example — Claude Code:
claude mcp add --transport http langfuse \
  https://langfuse.caip.bmw.cloud/api/public/mcp \
  --header "Authorization: Basic {your-base64-token}"
Example — Cursor / VS Code (.cursor/mcp.json or .vscode/mcp.json):
{
  "servers": {
    "langfuse": {
      "url": "https://langfuse.caip.bmw.cloud/api/public/mcp",
      "headers": {
        "Authorization": "Basic {your-base64-token}"
      }
    }
  }
}
What You Can Do
Once connected, your AI assistant can use Langfuse MCP tools to:
| Capability | Description |
|---|---|
| Browse Traces | Search and inspect traces from your project |
| Manage Prompts | List, read, and update prompts |
| Query Metrics | Get trace counts, latency stats, and cost data |
| View Scores | Access evaluation scores and annotations |
Learn More
For the full list of available MCP tools and schemas, see the official Langfuse MCP Reference and [Langfuse MCP Server docs](MCP Server - Langfuse).
Best for: Non-Python applications (Java, Go, .NET, Kotlin, etc.) or teams with existing OpenTelemetry infrastructure
The CAIP Langfuse instance exposes a standard OTLP endpoint that can receive traces from any language or framework with OpenTelemetry support. No SDK installation beyond the standard OTel libraries is required.
OTLP Endpoint
https://langfuse.caip.bmw.cloud/api/public/otel
Authentication
Langfuse uses Basic Auth with your project API keys:
# Generate your auth token
echo -n "pk-lf-your-public-key:sk-lf-your-secret-key" | base64
Environment Variables (Any Language)
Configure any OTel-instrumented application to export traces to Langfuse:
OTEL_EXPORTER_OTLP_ENDPOINT=https://langfuse.caip.bmw.cloud/api/public/otel
OTEL_EXPORTER_OTLP_HEADERS="Authorization=Basic <your-base64-token>,x-langfuse-ingestion-version=4"
OTEL_EXPORTER_OTLP_PROTOCOL=http/protobuf
Example: Python with OpenTelemetry SDK
from opentelemetry import trace
from opentelemetry.sdk.trace import TracerProvider
from opentelemetry.sdk.trace.export import BatchSpanProcessor
from opentelemetry.exporter.otlp.proto.http.trace_exporter import OTLPSpanExporter
import base64

# Build auth header
public_key = "pk-lf-your-public-key"
secret_key = "sk-lf-your-secret-key"
auth_token = base64.b64encode(f"{public_key}:{secret_key}".encode()).decode()

# Configure OTLP exporter pointing to CAIP Langfuse
exporter = OTLPSpanExporter(
    endpoint="https://langfuse.caip.bmw.cloud/api/public/otel/v1/traces",
    headers={
        "Authorization": f"Basic {auth_token}",
        "x-langfuse-ingestion-version": "4",
    },
)

# Set up tracer
provider = TracerProvider()
provider.add_span_processor(BatchSpanProcessor(exporter))
trace.set_tracer_provider(provider)
tracer = trace.get_tracer("my-application")

# Create traces
with tracer.start_as_current_span("process-request") as span:
    span.set_attribute("langfuse.user.id", "user_123")
    span.set_attribute("langfuse.session.id", "session_456")
    span.set_attribute("langfuse.trace.tags", '["production", "api"]')

    with tracer.start_as_current_span("call-llm") as gen_span:
        gen_span.set_attribute("gen_ai.request.model", "gpt-4o")
        gen_span.set_attribute("gen_ai.usage.input_tokens", 150)
        gen_span.set_attribute("gen_ai.usage.output_tokens", 50)
        # Your LLM call here

provider.shutdown()
Example: OpenTelemetry Collector
If your team uses an OTel Collector, add Langfuse as an exporter:
exporters:
  otlphttp/langfuse:
    endpoint: "https://langfuse.caip.bmw.cloud/api/public/otel"
    headers:
      Authorization: "Basic <your-base64-token>"
      x-langfuse-ingestion-version: "4"

service:
  pipelines:
    traces:
      receivers: [otlp]
      processors: [batch]
      exporters: [otlphttp/langfuse]
Supported Languages
Any language with OTel SDK support can send traces to Langfuse:
| Language | OpenTelemetry SDK |
|---|---|
| Java / Kotlin | opentelemetry-java |
| Go | opentelemetry-go |
| .NET / C# | opentelemetry-dotnet |
| Ruby | opentelemetry-ruby |
| Rust | opentelemetry-rust |
| PHP | opentelemetry-php |
Key Attributes
Set these OTel span attributes for proper Langfuse mapping:
| Attribute | Maps to | Example |
|---|---|---|
langfuse.user.id | Trace User ID | "user_123" |
langfuse.session.id | Trace Session ID | "session_456" |
langfuse.trace.name | Trace Name | "chat-request" |
langfuse.trace.tags | Trace Tags | '["prod", "v2"]' |
gen_ai.request.model | Model Name | "gpt-4o" |
gen_ai.usage.input_tokens | Input Tokens | 150 |
gen_ai.usage.output_tokens | Output Tokens | 50 |
Langfuse supports OTLP over HTTP with both HTTP/JSON and HTTP/protobuf. gRPC is not supported.
Learn More
For the full attribute mapping and advanced configuration, see the [Langfuse OpenTelemetry documentation](OpenTelemetry (OTEL) for LLM Observability - Langfuse).
Step 5: View Your Traces
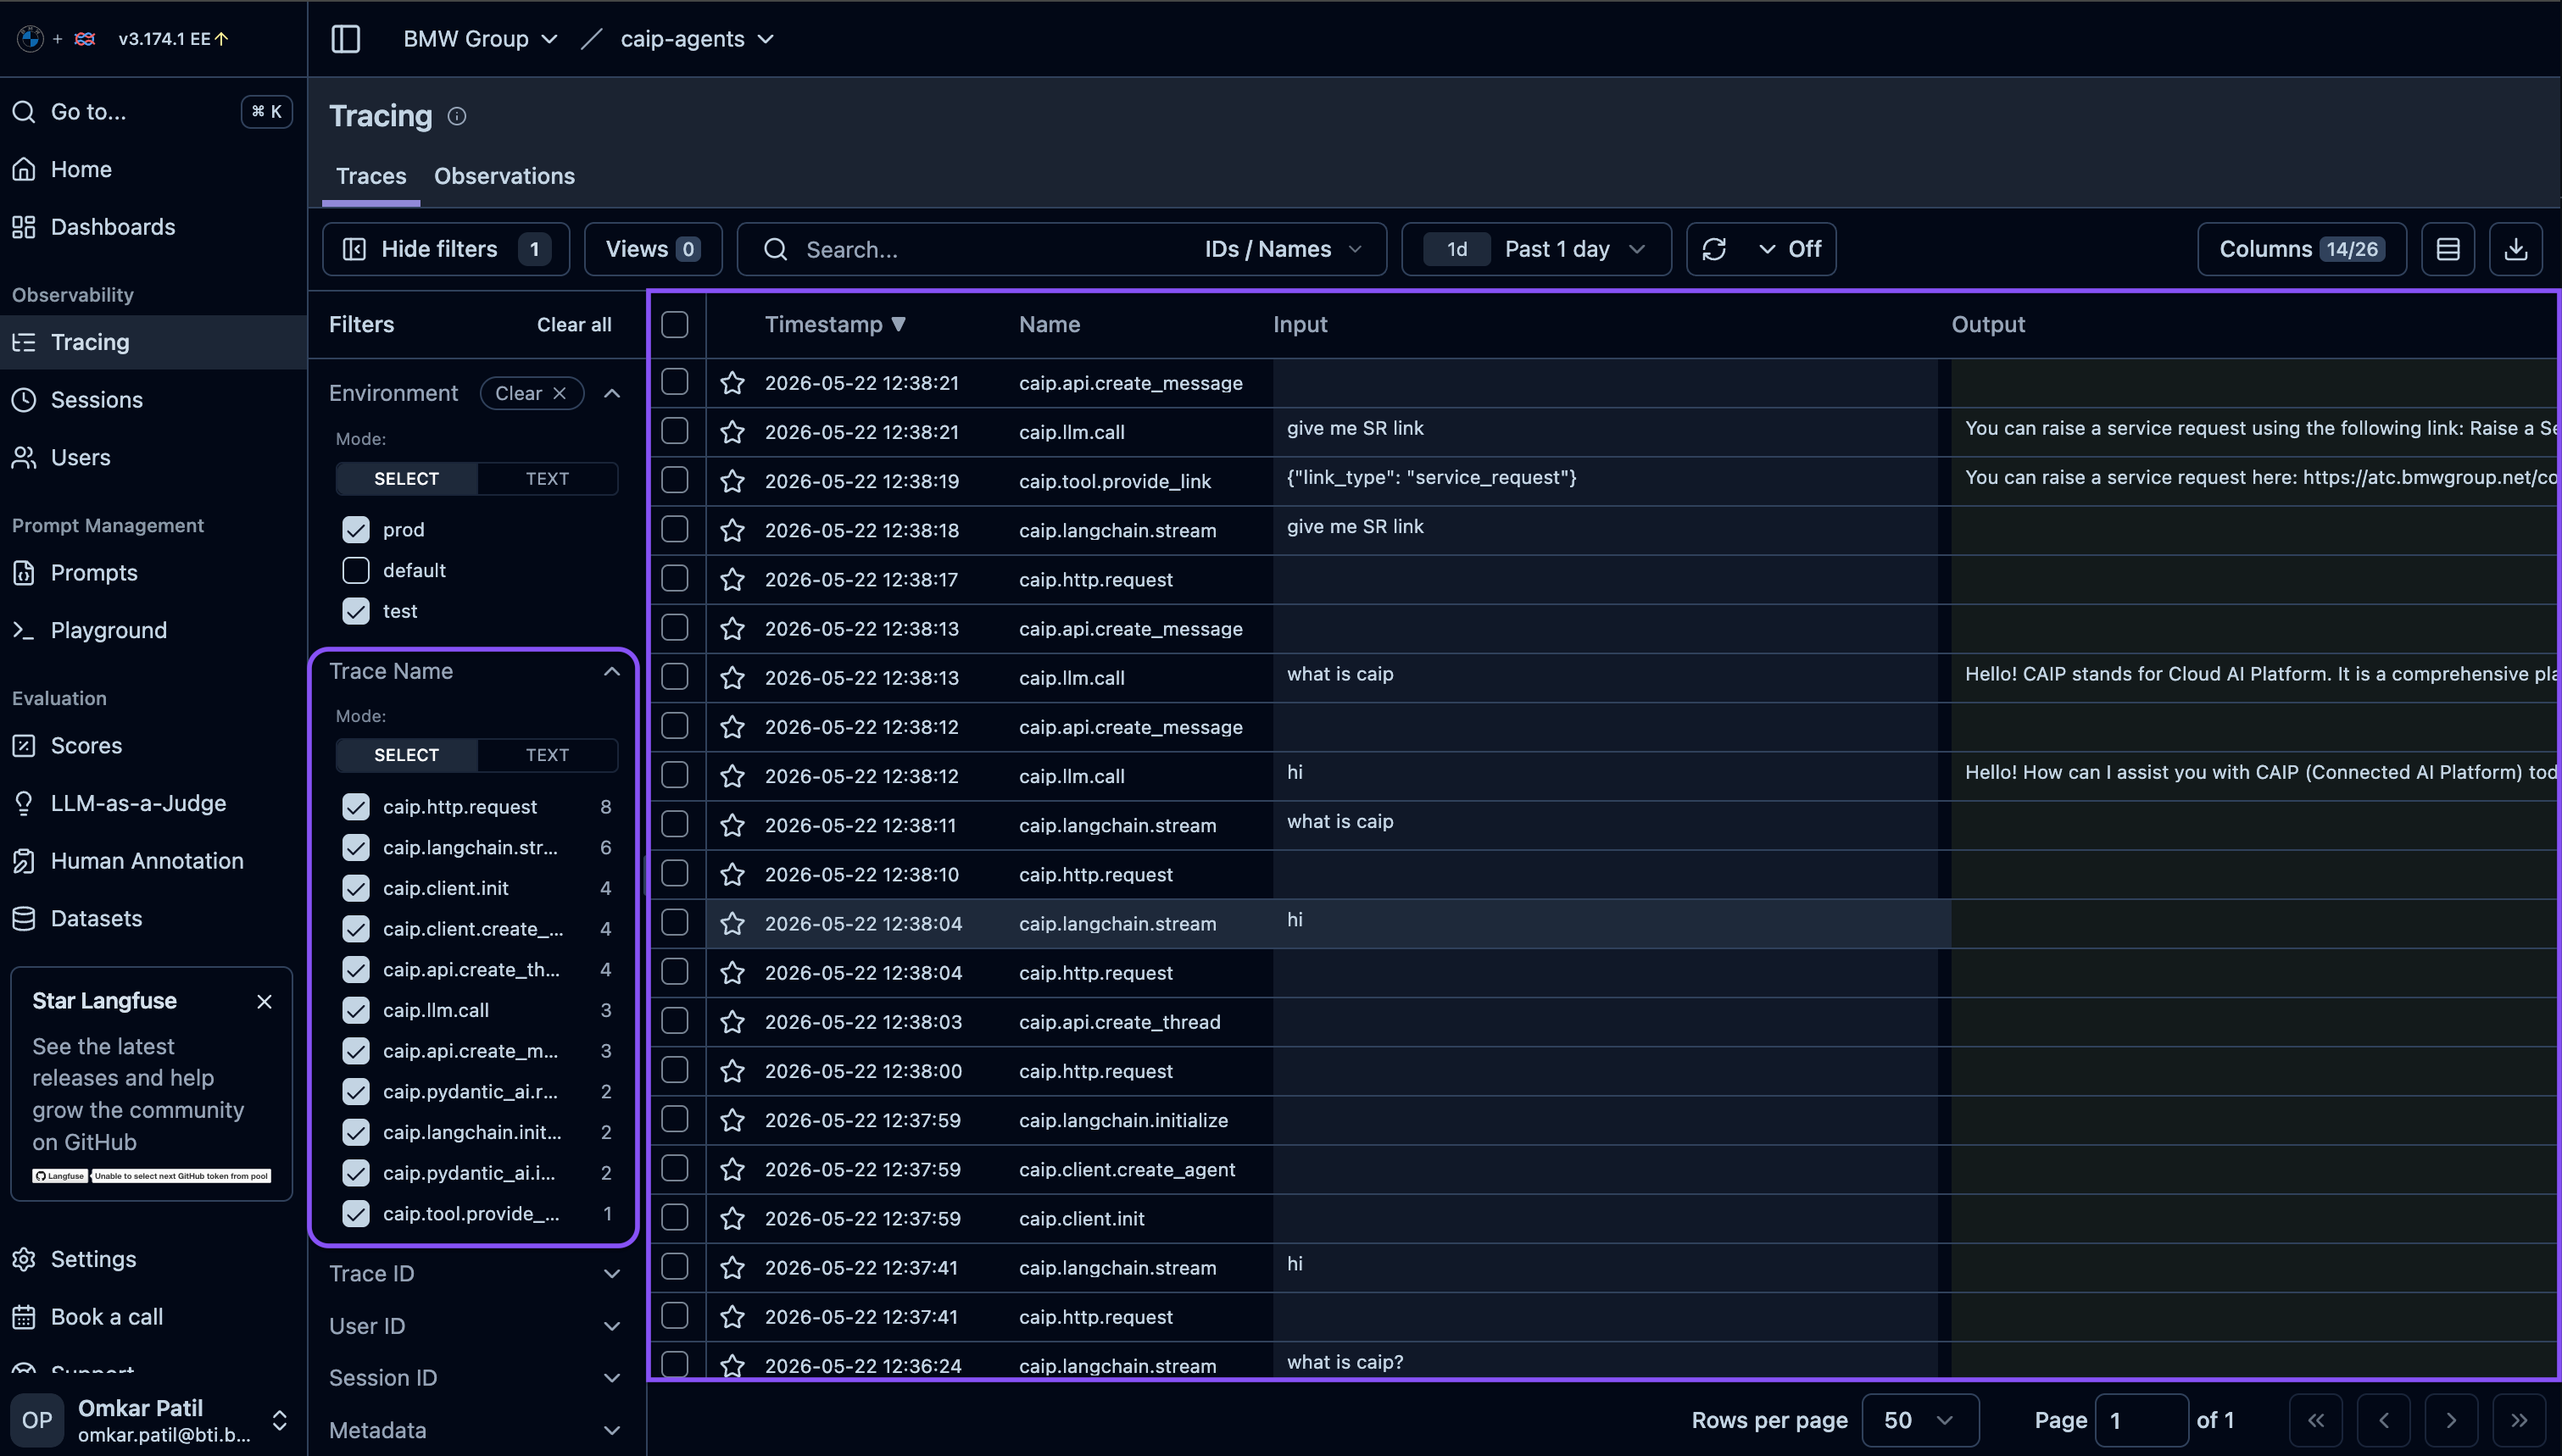
After running your application, open the Langfuse dashboard to see your traces:
- Navigate to Traces in the left sidebar
- Your traces appear in real-time (may take a few seconds)
- Click any trace to see the detailed execution tree
What You'll See
| Column | Description |
|---|---|
| Timestamp | When the trace started |
| Name | The root operation name |
| User | User ID (if set via propagate_attributes) |
| Latency | Total execution time |
| Tokens | Input + output token count |
| Cost | Estimated cost based on model pricing |
Step 6: Filter by Environment
Use the LANGFUSE_ENV variable to tag traces by environment:
# Tag your traces with environment name
LANGFUSE_ENV=prod
Then filter traces in the dashboard:
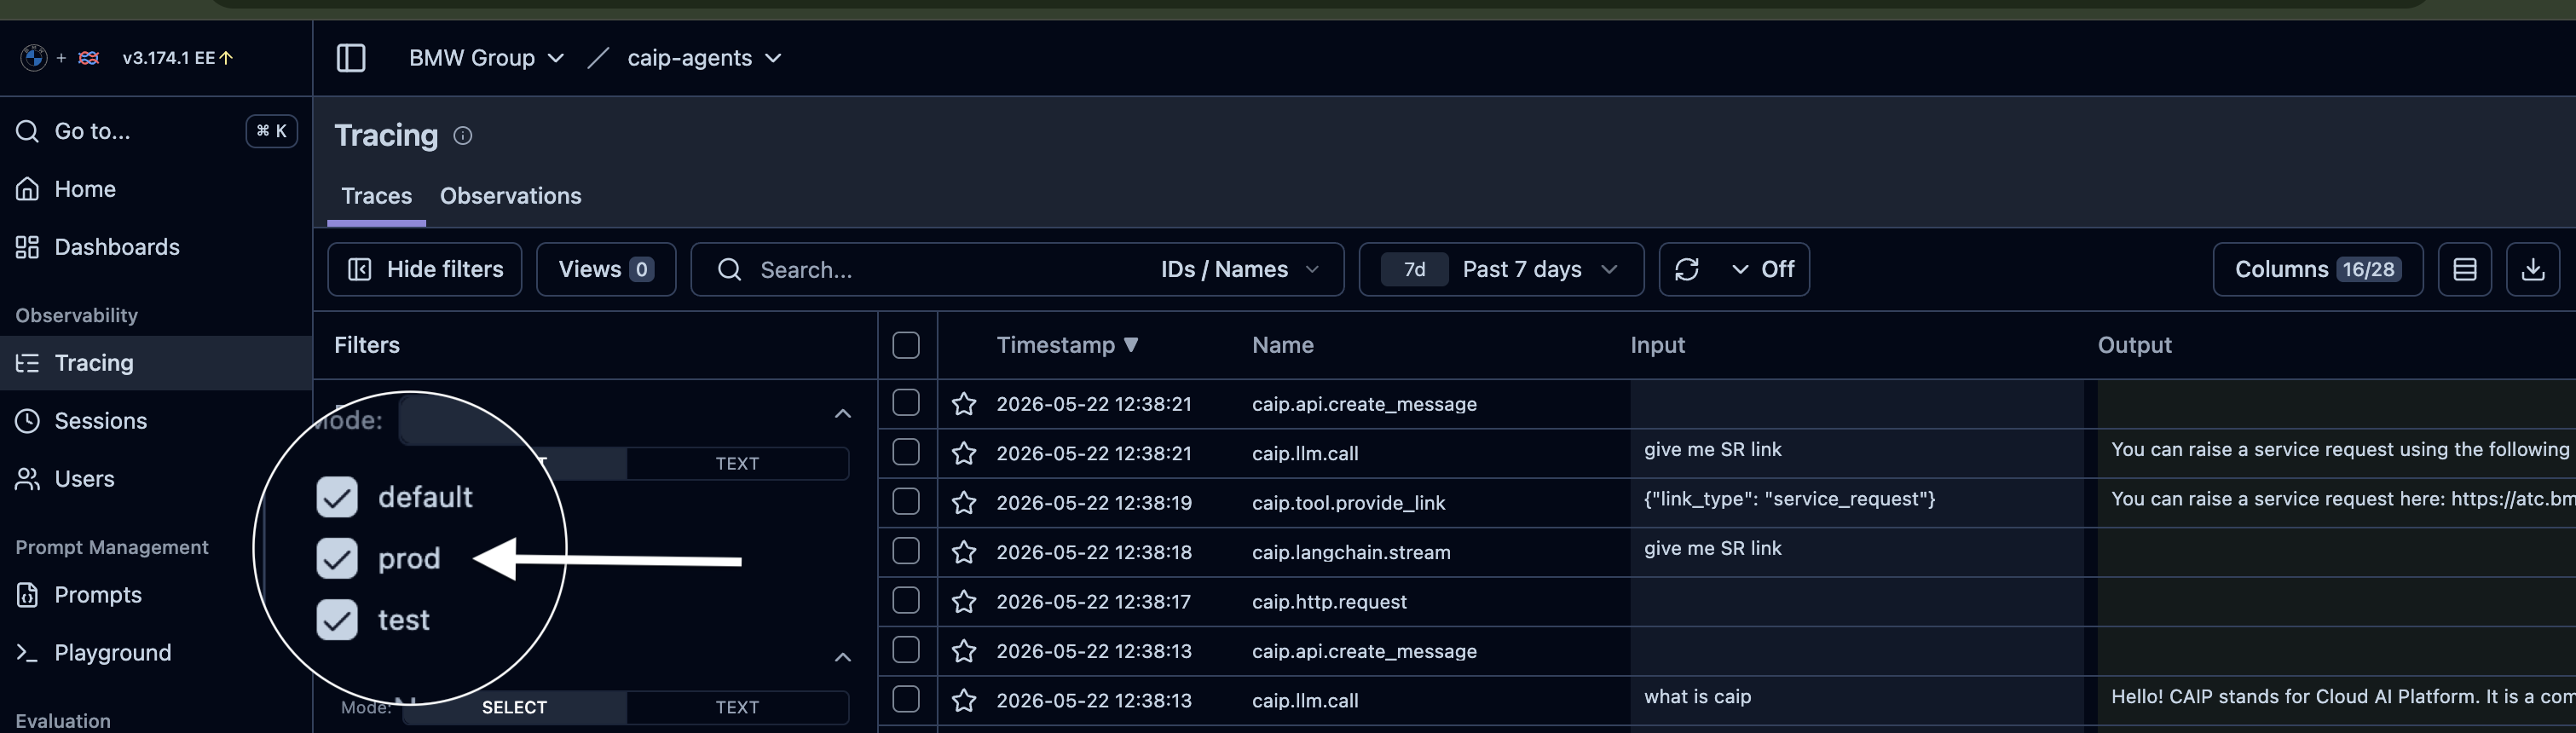
This makes it easy to filter traces by environment when you have multiple deployments.
Troubleshooting
Traces Not Appearing
| Issue | Solution |
|---|---|
| Missing credentials | Verify LANGFUSE_PUBLIC_KEY and LANGFUSE_SECRET_KEY are set |
| Tracing disabled by config | Remove CAIP_LANGFUSE_OBSERVABILITY=false from your .env |
| Wrong host URL | Check LANGFUSE_HOST matches your environment |
| No flush before exit | Call flush() before your program ends |
Debug Mode
Enable verbose debug logging to see every span open/close and generation update:
LANGFUSE_DEBUG=true
When enabled, the SDK logs detailed trace activity to your console:
🔍 Langfuse debug mode ENABLED — verbose trace logging active
▶ GENERATION OPEN: caip.pydantic_ai.run [model=gpt-4o]
⟳ GENERATION UPDATE: caip.pydantic_ai.run | keys=['input', 'output', 'usage_details']
◼ GENERATION CLOSE: caip.pydantic_ai.run [model=gpt-4o] status=OK
This is useful for verifying that traces are being created correctly during local development.
Next Steps
- UI Guide — Navigate the Langfuse dashboard
- Project Settings — Configure API keys and team access
- Tracing Guide — Deep dive into trace instrumentation