UI Guide
This guide provides a high-level overview of the Langfuse user interface, helping you navigate the main sections and find the features you need.
Accessing Langfuse
Navigate to the Langfuse dashboard and log in with your BMW WebEAM credentials:
| Region | Environment | URL |
|---|---|---|
| ROW | Production | langfuse.caip.bmw.cloud |
| CN | Production | langfuse.caip.bmwchina.cloud |
Main Navigation
After logging in and navigating to your project, you'll see the project's main dashboard with the left sidebar navigation:
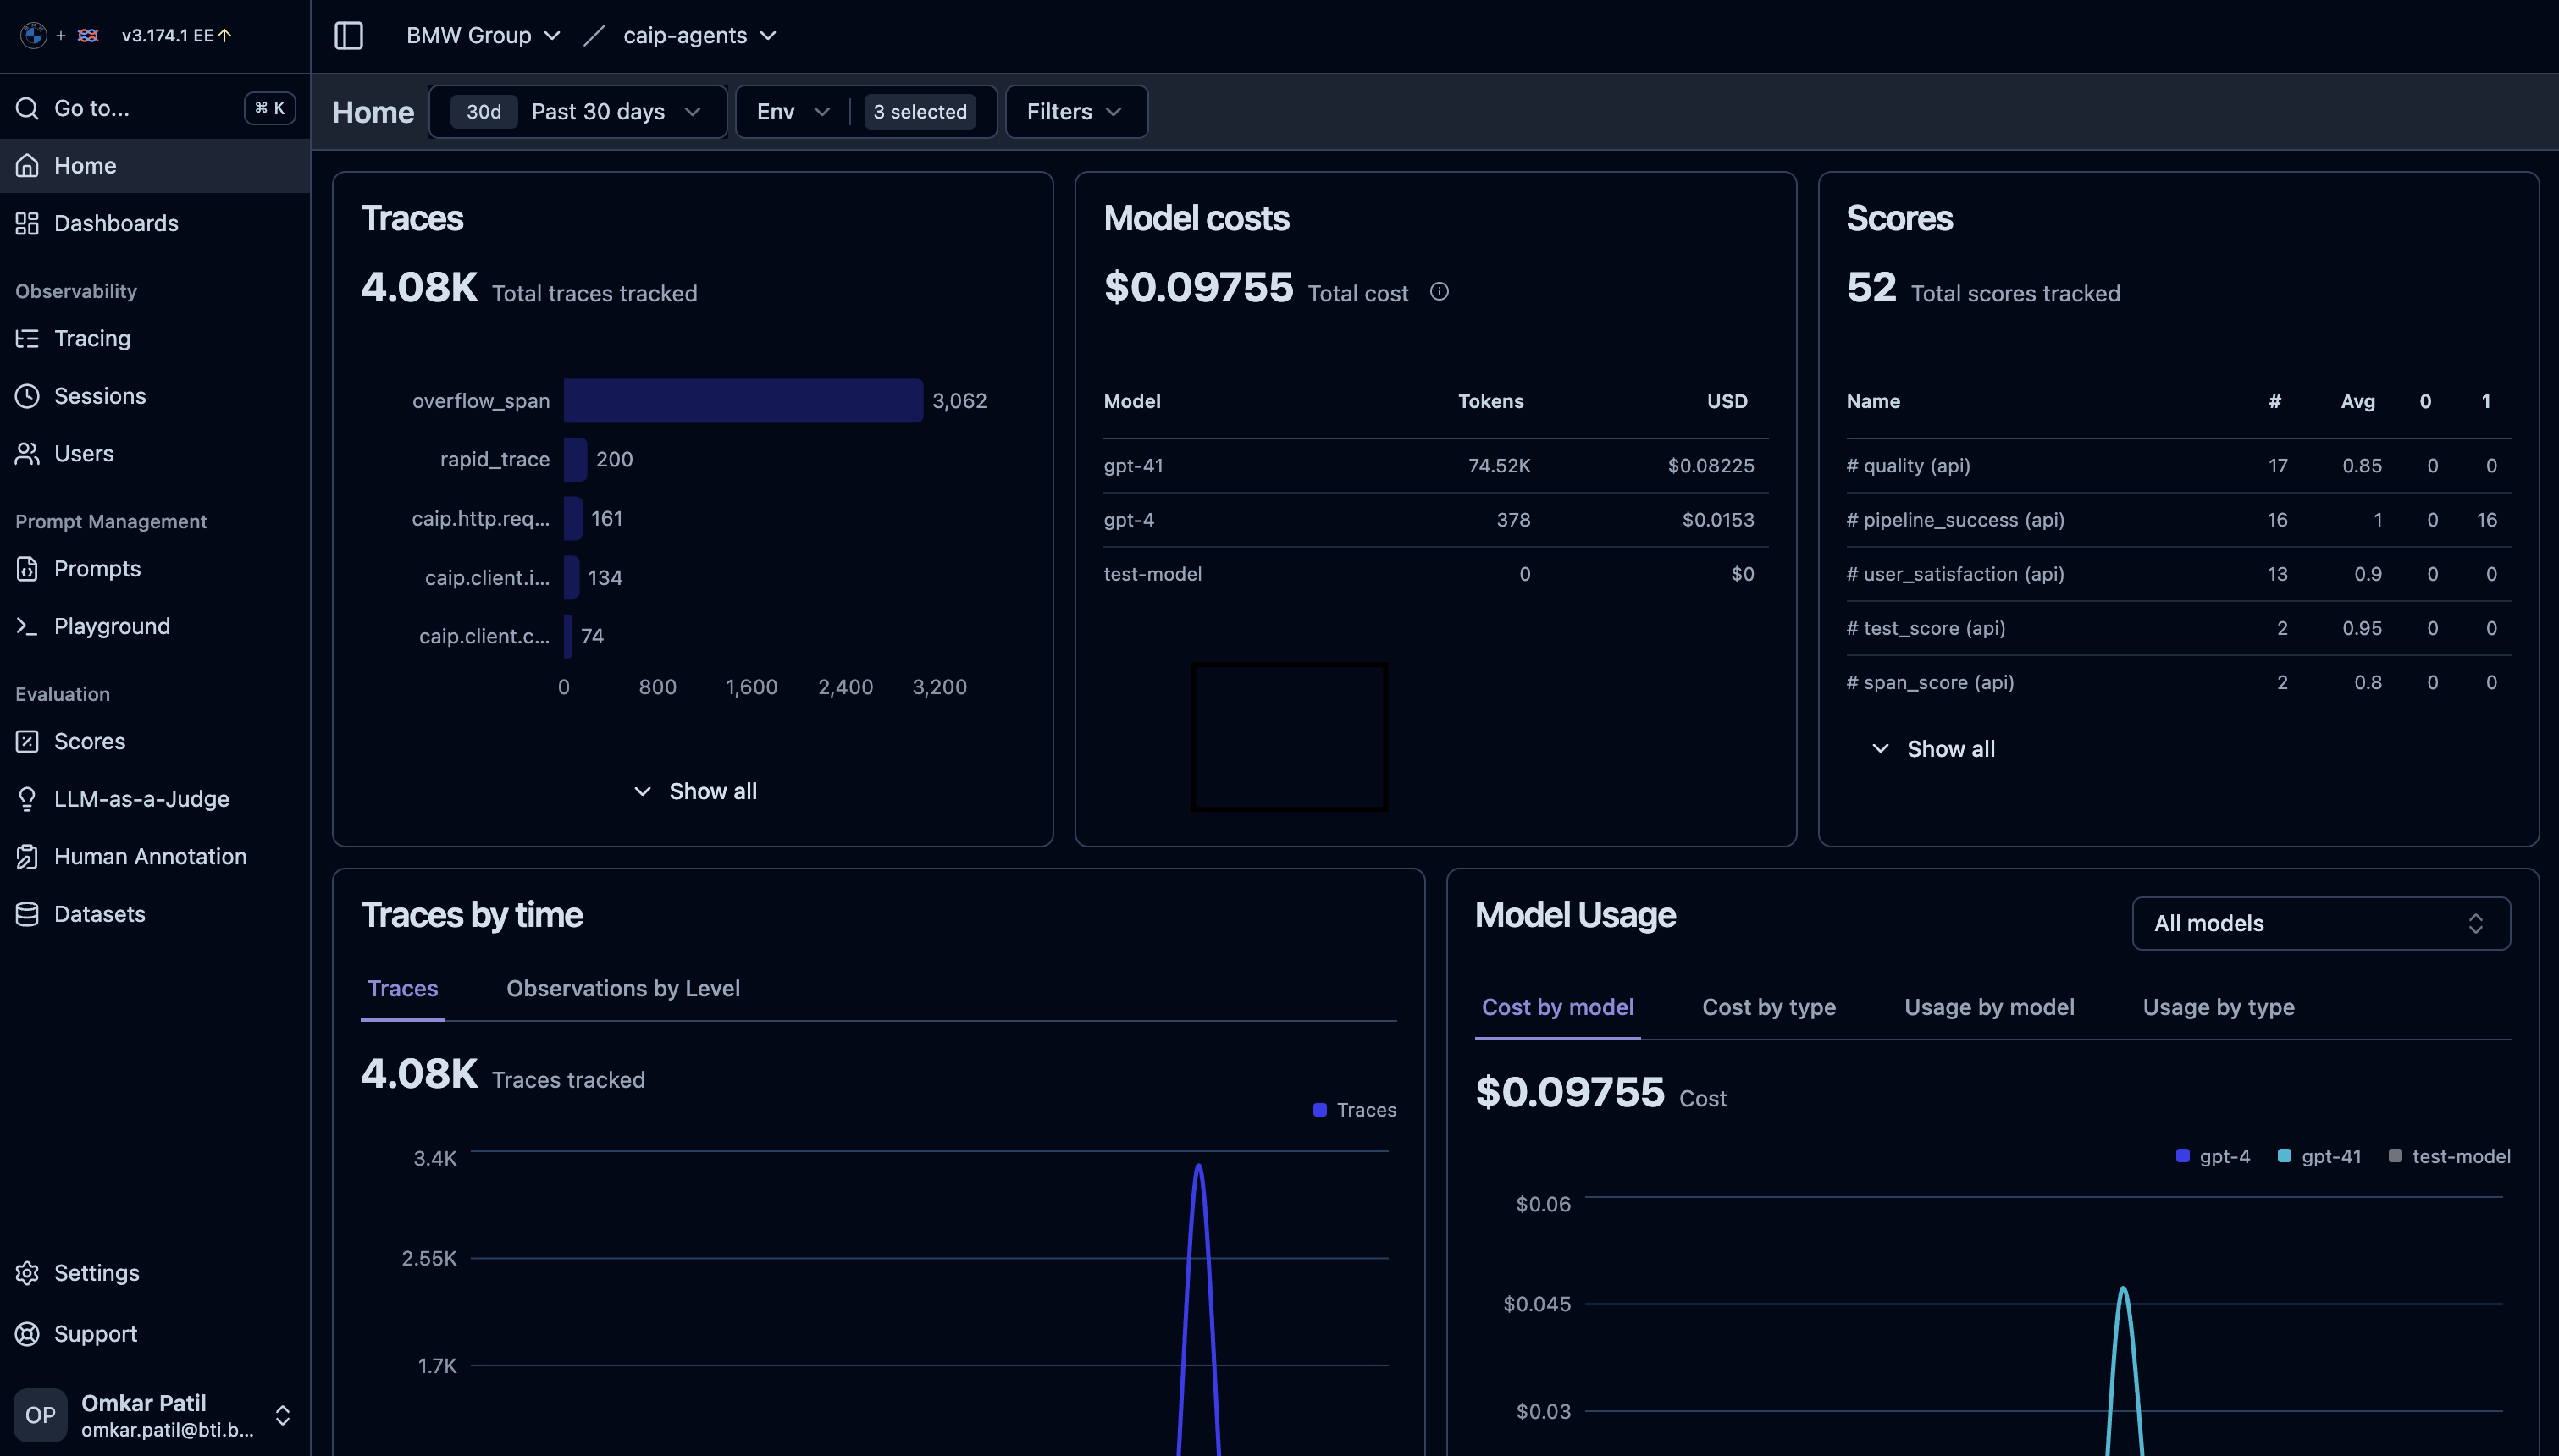
Navigation Structure
Langfuse Dashboard
├── 📊 Dashboard (Metrics Overview)
├── 📍 Traces (Request Executions)
├── ⚡ Generations (LLM Calls)
├── 👤 Users (User Analytics)
├── 💬 Sessions (Conversation Groups)
├── 📈 Metrics (Custom Dashboards)
└── ⚙️ Settings (Project Configuration)
Main Sections
Dashboard
The Dashboard is your landing page showing key metrics at a glance.
What you'll find:
- Total traces and generations
- Token usage summary
- Cost overview
- Quick time-range selectors
When to use:
- Get a quick health check of your application
- Monitor daily/weekly trends
- Identify unusual spikes or drops
Traces
The Traces section shows all request executions from your application.
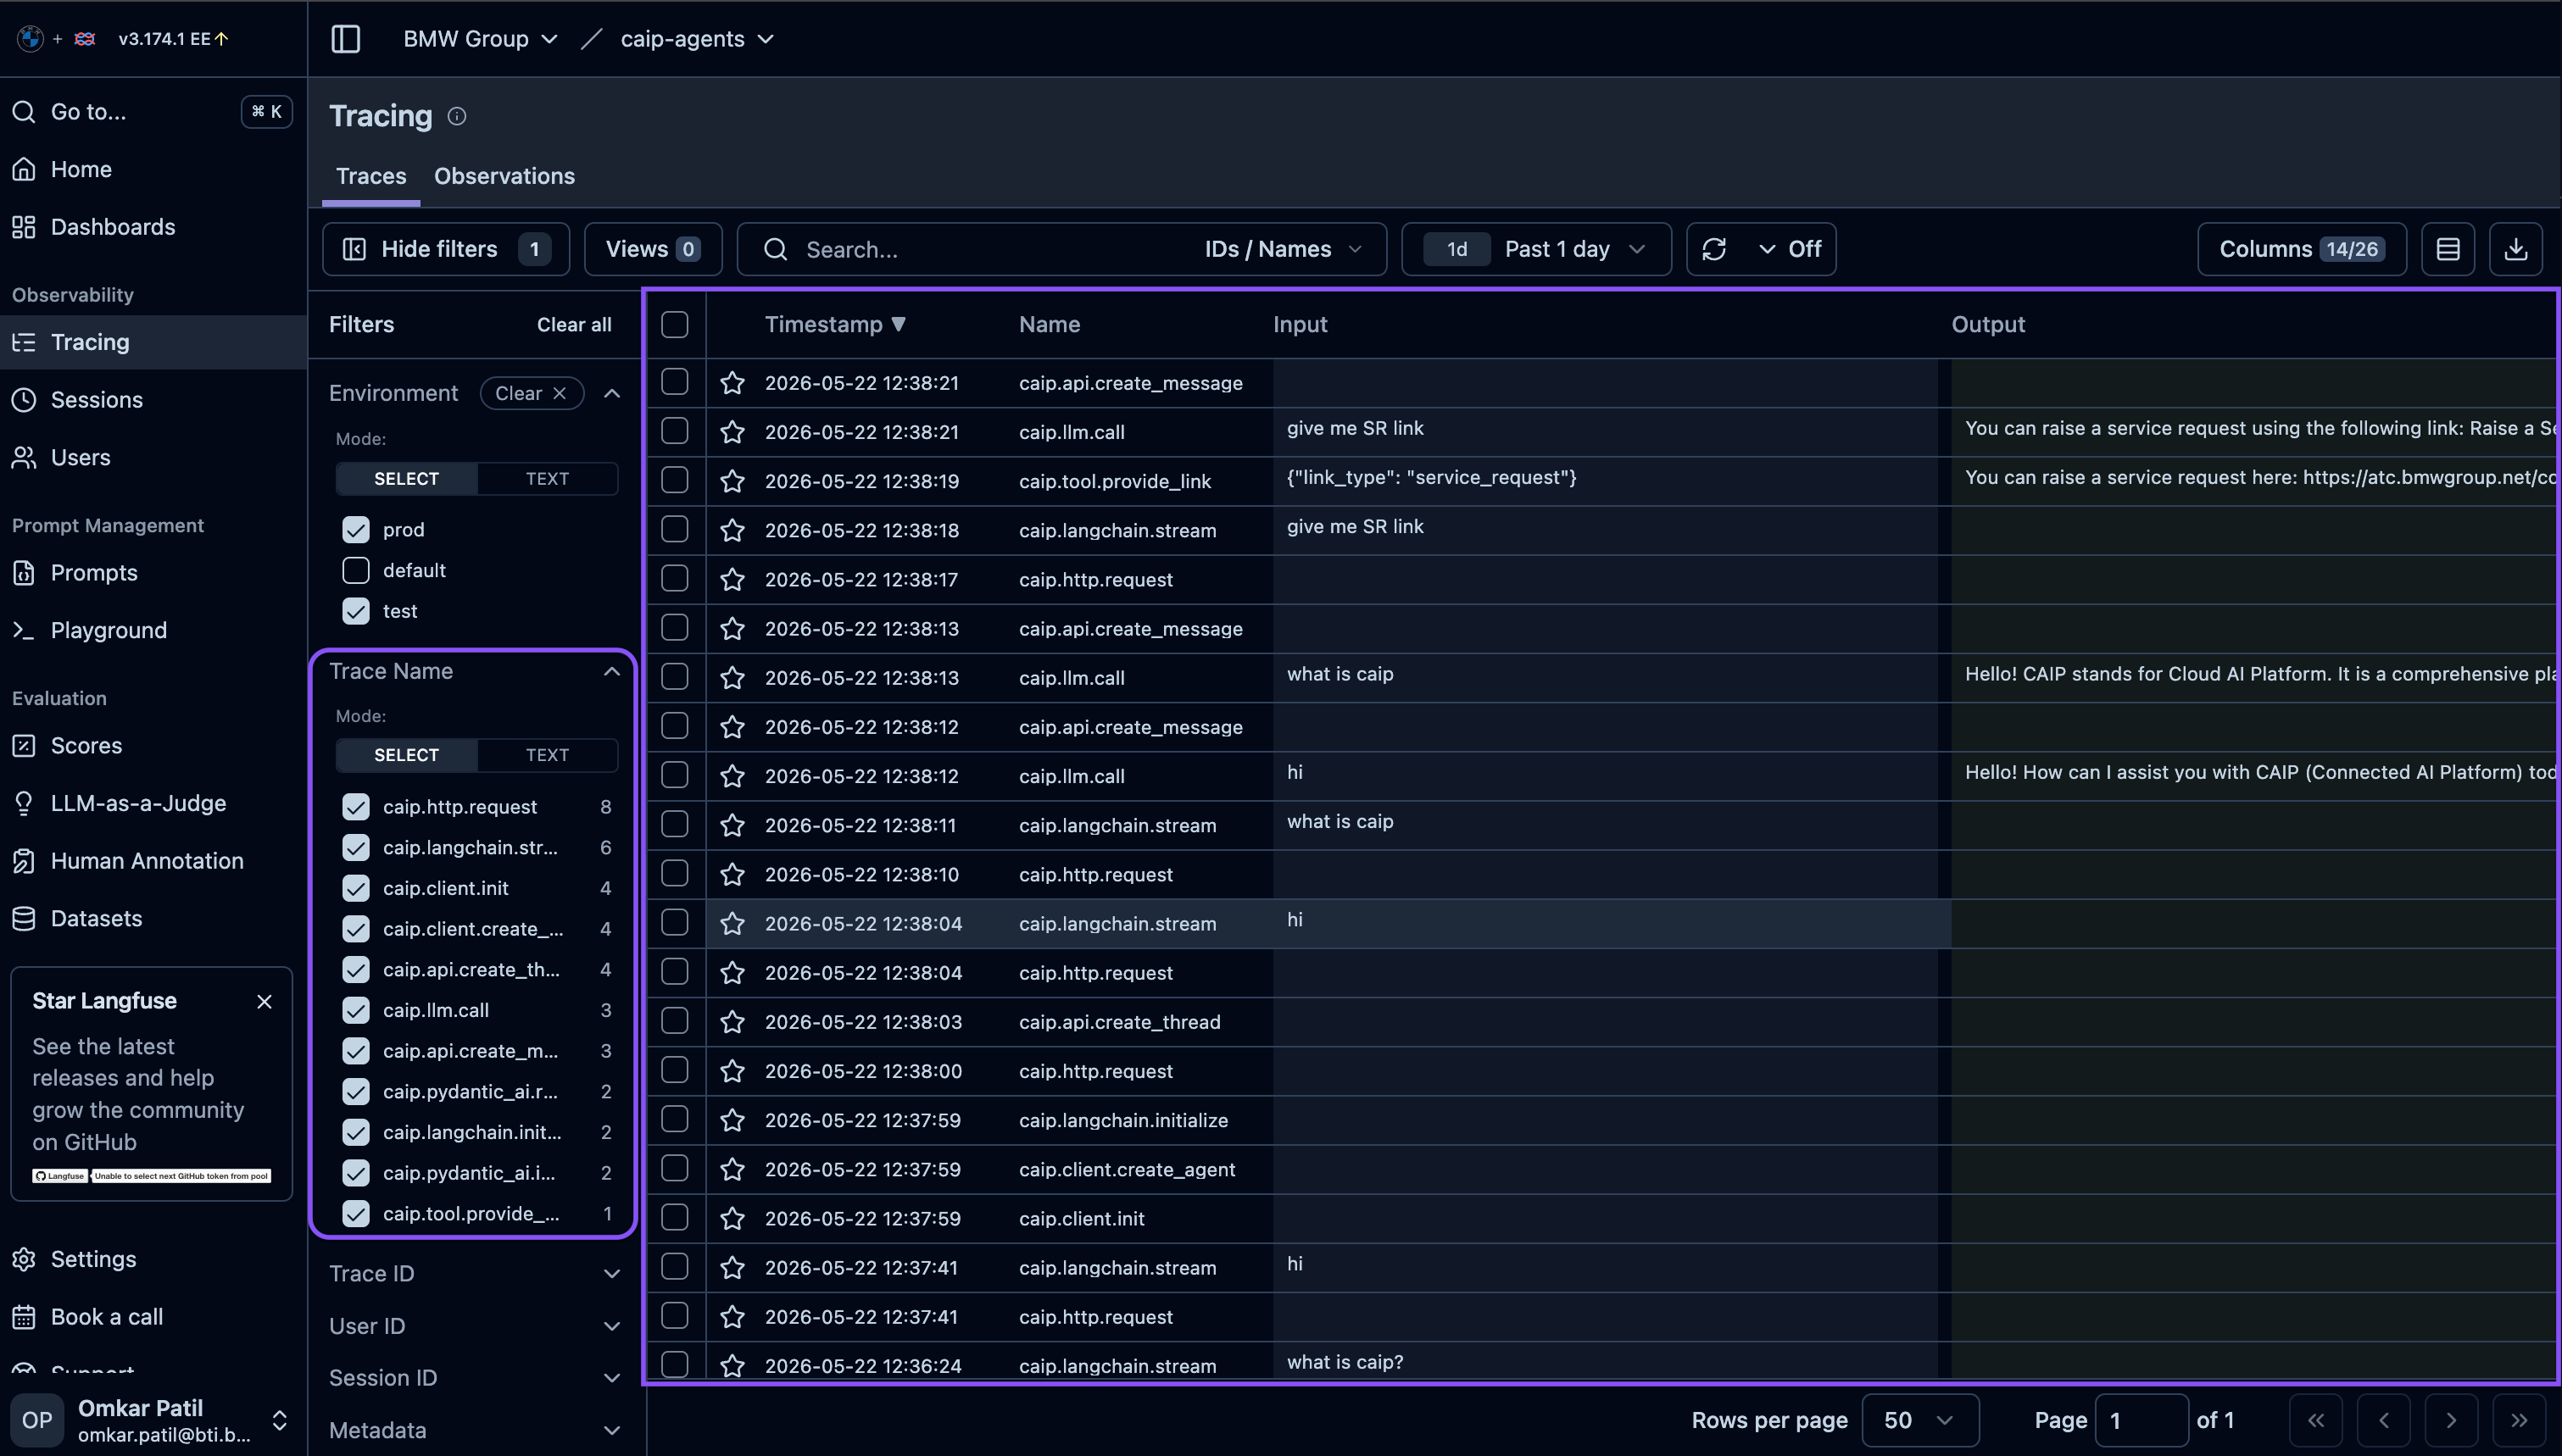 What you'll find:
- List of all traces with search and filters
- Detailed trace view with execution tree
- Input/output inspection
- Timing breakdown
When to use:
- Debug specific requests
- Find slow operations
- Investigate errors
- Analyze user interactions
For detailed trace analysis, see the Tracing Guide.
Users
The Users section shows aggregated data by user.
 What you'll find:
- User list with activity metrics
- Per-user trace counts
- Token usage by user
- Cost attribution
When to use:
- Debug user-specific issues
- Identify power users
- Analyze usage patterns
- Track per-user costs
For detailed user tracking, see Users & Sessions.
Sessions
The Sessions section groups traces into conversations.
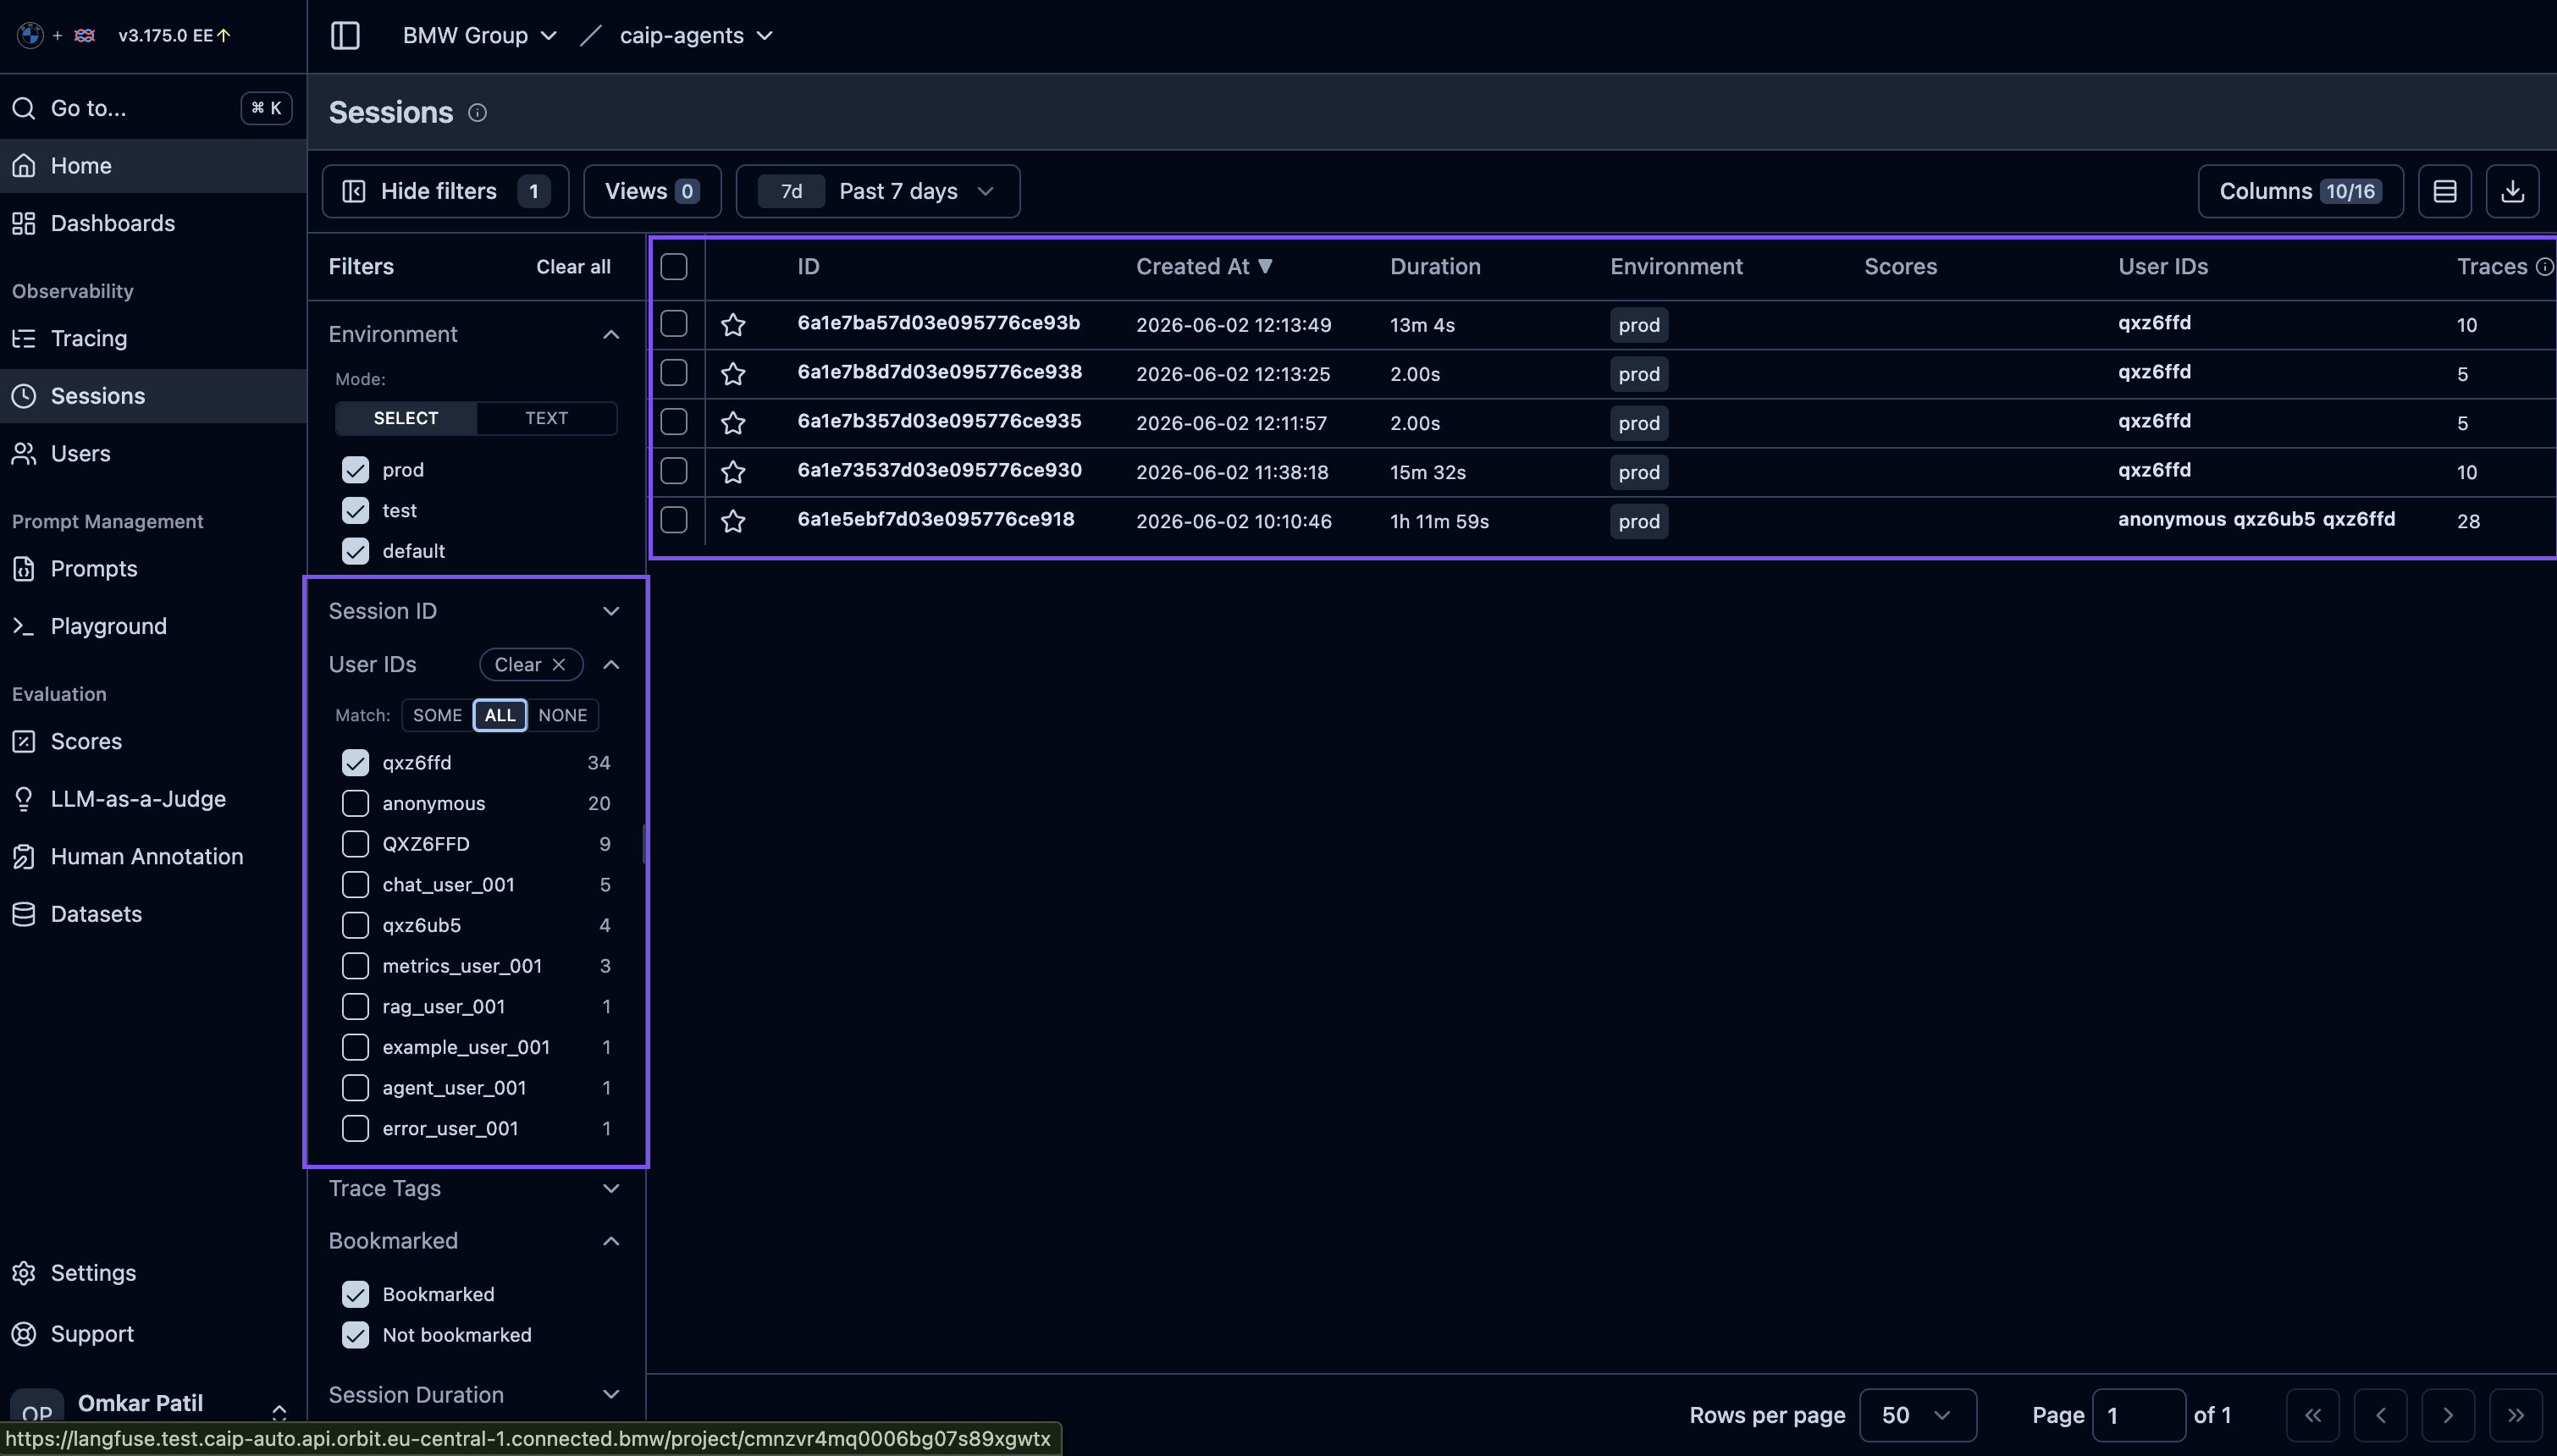 What you'll find:
- Session list with conversation threads
- Multi-turn interaction views
- Session-level metrics
- Conversation timeline
When to use:
- Debug multi-turn conversations
- Analyze conversation flows
- Understand user journeys
- Track conversation costs
For detailed session tracking, see Users & Sessions.
Metrics
The Metrics section provides customizable dashboards for monitoring your application.
What you'll find:
- Request volume over time
- Latency percentiles (P50, P95, P99)
- Token usage trends
- Cost projections
- Error rates
Usage Dashboard
The usage dashboard gives you a quick overview of your application's activity:
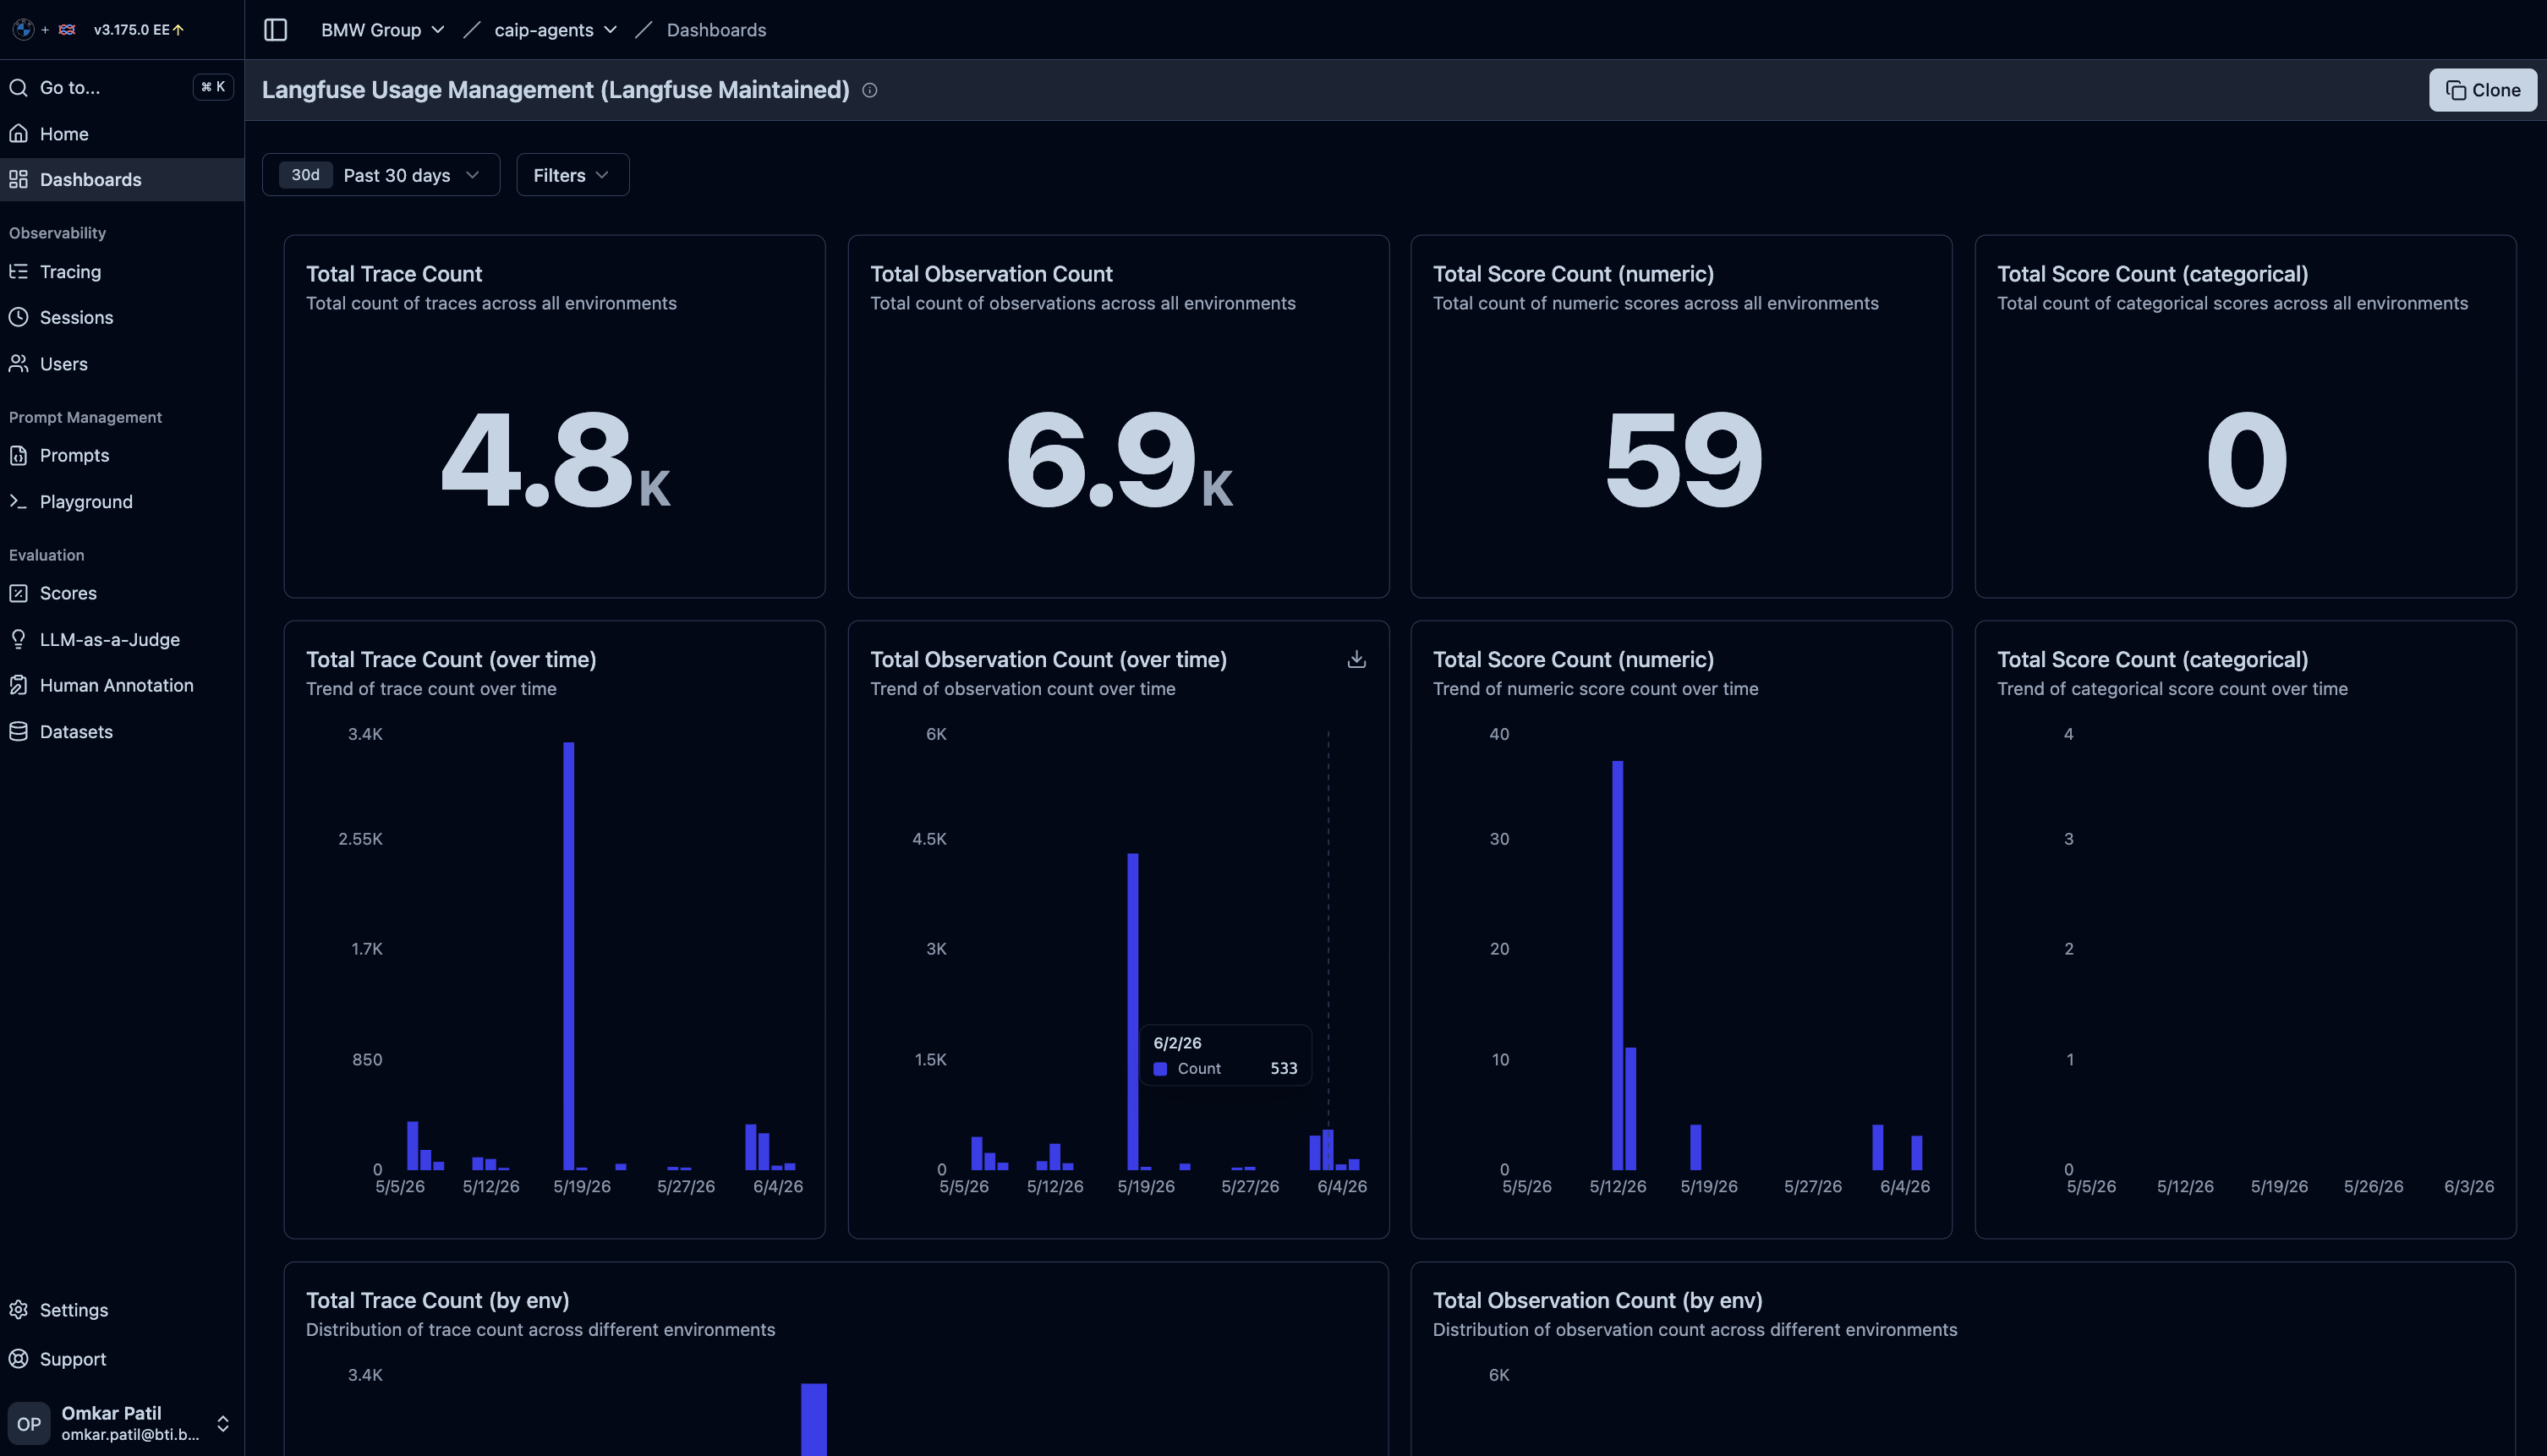
Available Metrics:
| Metric | Description |
|---|---|
| Request Volume | Traces/generations over time |
| Latency Percentiles | P50, P95, P99 response times |
| Token Usage | Input/output/total tokens |
| Cost Trends | Spending over time |
| Error Rate | Failed traces as percentage |
| Model Distribution | Usage breakdown by model |
Time Range Options:
- Last hour / 24 hours / 7 days / 30 days
- Custom date range
- Automatic refresh intervals
Creating Custom Dashboards
Langfuse allows you to create custom dashboards with widgets tailored to your specific monitoring needs.
Step 1: Create a New Dashboard
Navigate to Dashboards and click Create Dashboard to start building your custom view:

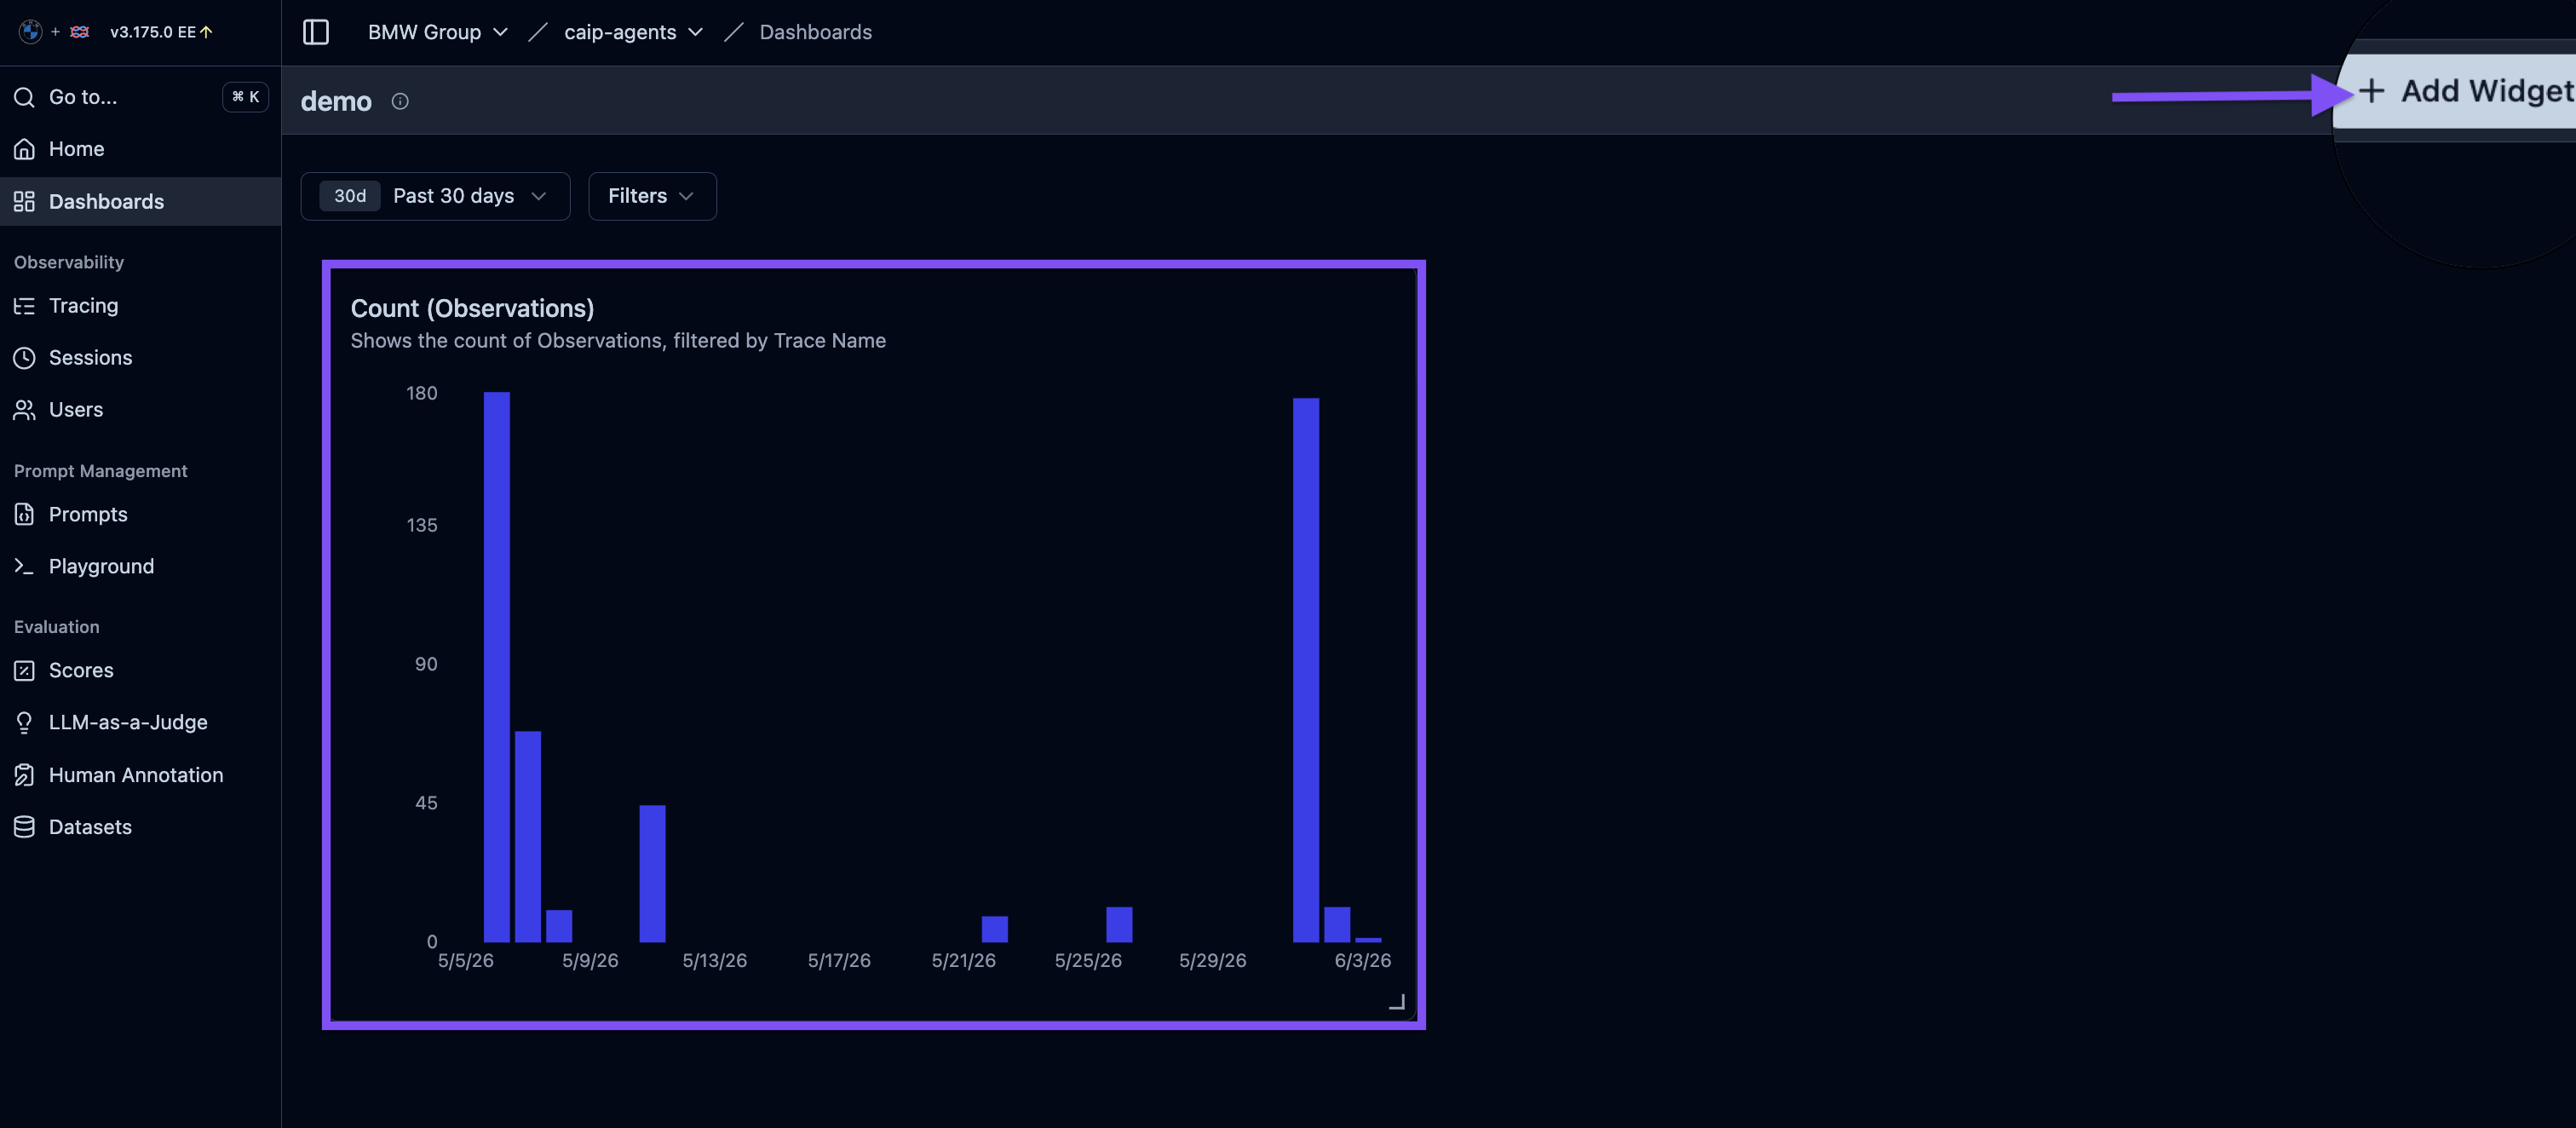
Step 2: Add Widgets
Click Add Widget to add visualization components to your dashboard:
Step 3: Configure Widget Settings
Select the metrics, time range, and visualization type for each widget:
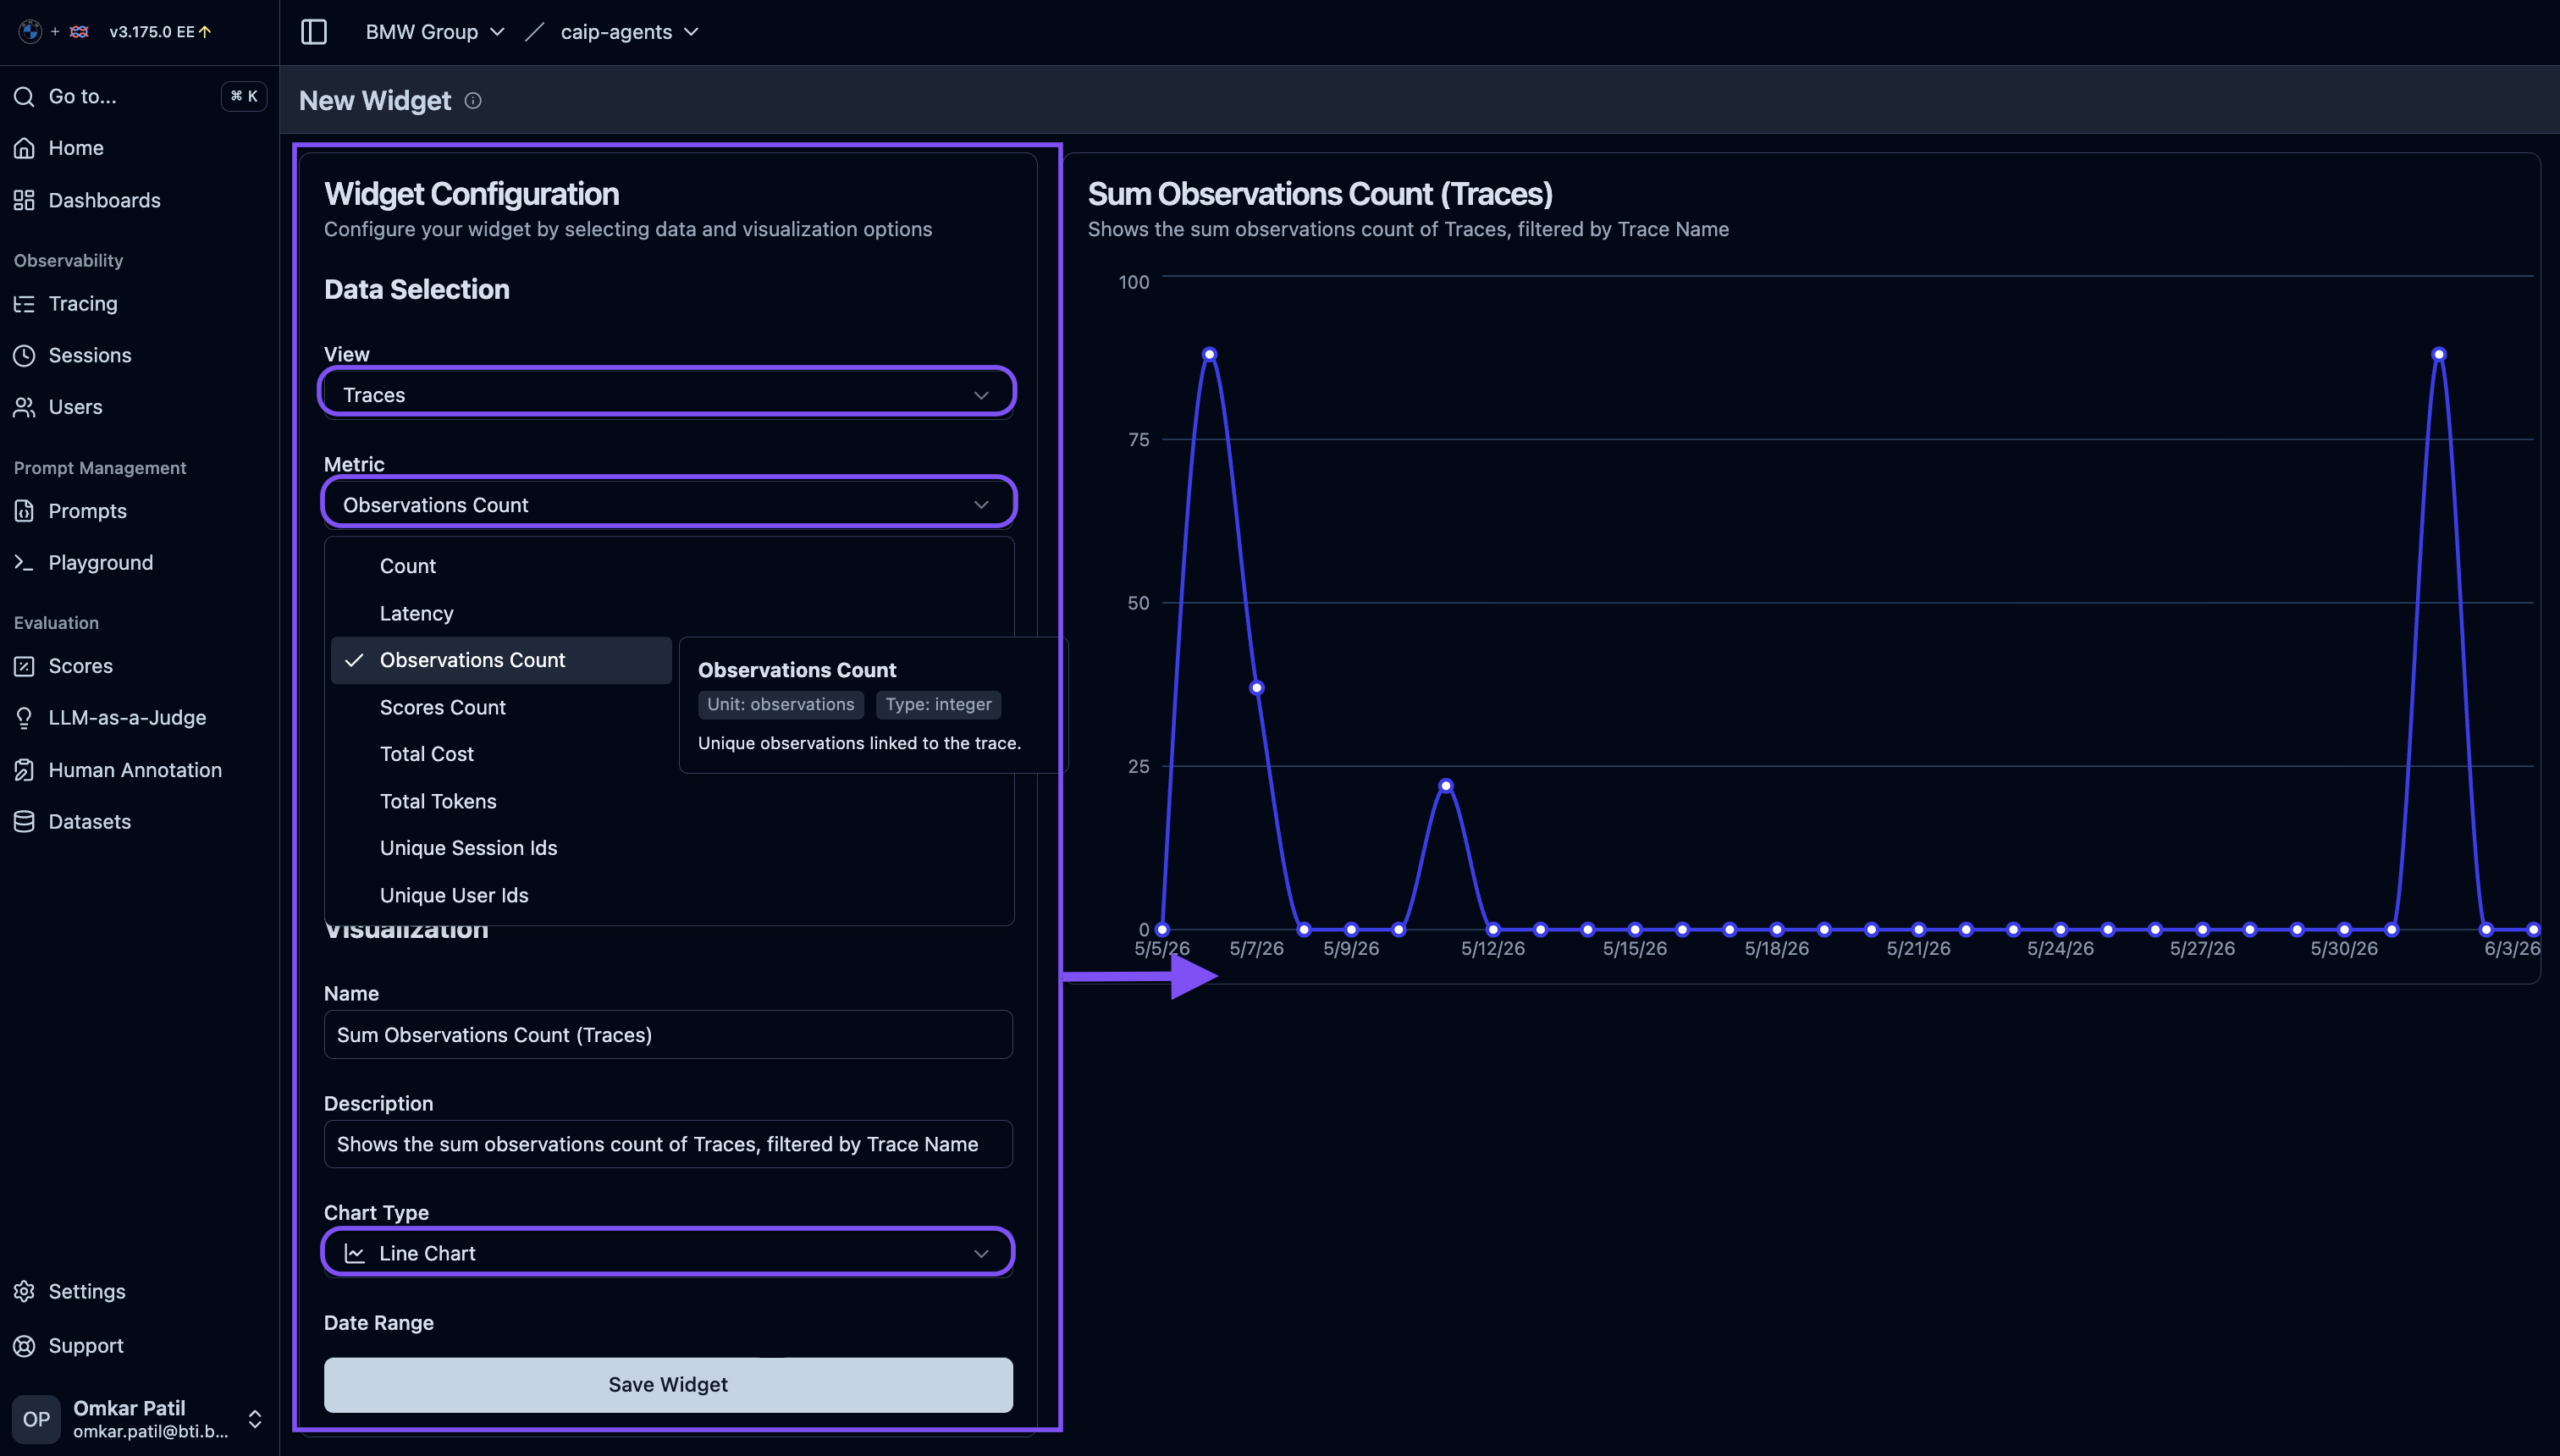
Widget Types Available:
| Widget | Use Case |
|---|---|
| Line Chart | Trends over time (latency, cost, volume) |
| Bar Chart | Comparisons (models, users, tags) |
| Metric Card | Single KPI display |
| Table | Detailed breakdowns |
| Pie Chart | Distribution analysis |
Common Custom Dashboard Use Cases:
- Cost Monitoring: Track spending by model, user, or feature
- Performance SLOs: Monitor P95 latency against targets
- Usage Patterns: Analyze peak hours and user behavior
- Error Tracking: Visualize error rates and types
Settings
The Settings section manages project configuration.
What you'll find:
- Project details
- API key management
- Team members
- Model pricing
- Integrations
For detailed settings documentation, see Project Settings.
Quick Actions
Search
Use the search bar (⌘/Ctrl + K) to quickly find:
- Traces by ID
- Users by ID
- Sessions by ID
Time Range
All views support time range filtering:
- Click the time selector in the top right
- Choose preset ranges or custom dates
- Time applies to all views
Deep Links
Copy URLs to share specific:
- Traces
- Filters
- Dashboard views
URLs preserve all filter parameters.
UI Tips
⌘/Ctrl + K— Quick search↑/↓— Navigate listsEnter— Open selected itemEsc— Close panels
Click on any value (user ID, tag, model) to instantly filter by that value.
Click column headers to sort traces by that field.
Next Steps
- Project Settings — Configure API keys and team access
- Tracing Guide — Deep dive into trace instrumentation
- Users & Sessions — Track user activity and conversations